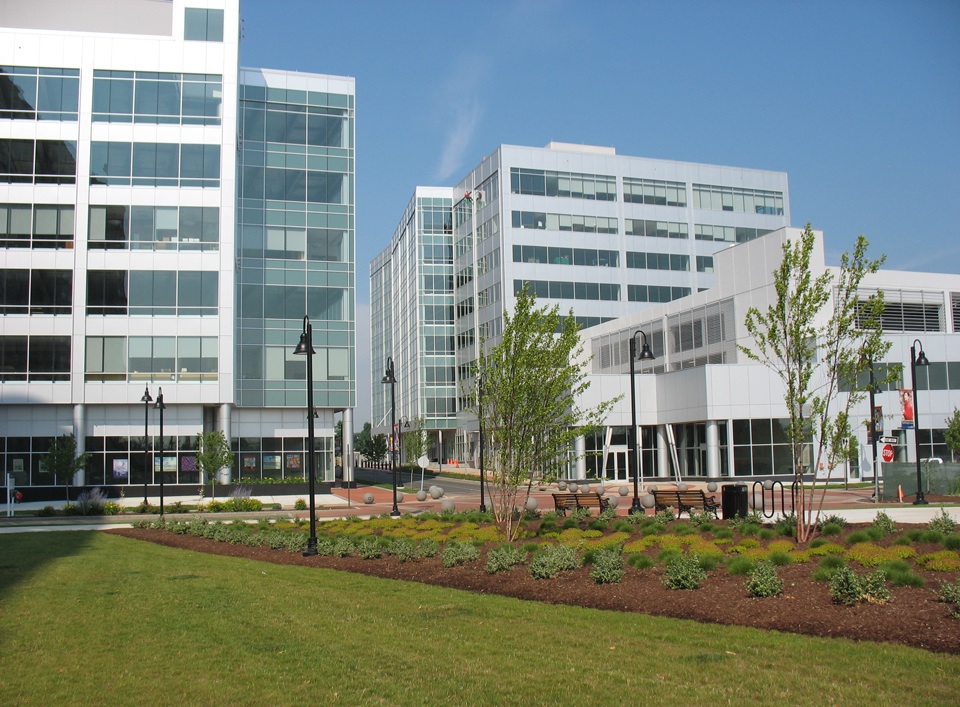
With an average cost per square foot of $16.11, Stamford, Conn., is the most costly U.S. market for commercial real estate, according to a new study by the Building Owners and Managers Association International. New York and San Francisco are also among the nation's priciest markets.
Using the results from the BOMA 2013 Experience Exchange Report, the group compiled a list of the most and least expensive commercial real estate city-markets in the United States. The annual report aggregates rental income and operating expense figures from the previous year; in 2012, data was gathered from more than 5,300 buildings across 250 markets and 115 cities in the United States and Canada.
Five most expensive city-markets – total operating expenses:
1. Stamford, Conn. $16.11 per square foot (psf)
2. New York $11.80 psf
3. Grand Rapids, Mich. $11.16 psf
4. Newark, N.J. $10.34 psf
5. San Francisco $9.66 psf
Five least expensive city-markets – total operating expenses:
1. Stockton, Calif. $3.57 psf
2. Fresno, Calif. $3.61 psf
3. Huntsville, Ala. $4.31 psf
4. Virginia Beach, Va. $4.64 psf
5. Albuquerque, N.M. $4.80 psf
Total operating expenses incorporate all expenses incurred to operate office buildings, including utilities, repairs and maintenance, roads and grounds, cleaning, administration, and security. Fixed expenses include real estate taxes, property taxes and insurance.
There was a 3.9 percent overall decrease in total operating expenses from 2011 to 2012, underscoring an industry focus on maximizing building efficiency in the face of dwindling income streams. For example, New York, which topped the list of most expensive markets for operating expenses last year, saw a decrease of $0.66 per square foot.
Five most expensive city-markets – total rental income:
1. Washington, D.C. $44.30 psf
2. New York $39.00 psf
3. San Mateo, Calif. $34.96 psf
4. San Francisco $34.49 psf
5. Santa Monica, Calif. $34.04 psf
Five least expensive city-markets – total rental income:
1. Macon, Ga. $8.16 psf
2. Shreveport, La. $11.18 psf
3. Columbus, Ohio $12.09 psf
4. Huntsville, Ala. $12.81 psf
5. Little Rock, Ark. $12.81 psf
Total rental income includes rental income from office, retail and other space, such as storage areas.
While average rental income has dropped somewhat, decreasing 2.9 percent from 2011 to 2012, building owners and managers are compensating for these income losses with greater reductions in expenses.
The Experience Exchange Report is the premier income and expense data benchmarking tool for the commercial real estate industry. The EER allows users to conduct multi-year analysis of single markets and select multiple cities to generate state and regional reports. It also offers the capability to search by building size, height, age and more for broader analysis. Subscriptions are available at www.bomaeer.com.
About BOMA International
The Building Owners and Managers Association (BOMA) International is a federation of 93 BOMA U.S. associations, BOMA Canada and its 11 regional associations and 13 BOMA international affiliates. Founded in 1907, BOMA represents the owners and managers of all commercial property types, including nearly 10 billion square feet of U.S. office space that supports 3.7 million jobs and contributes $205 billion to the U.S. GDP. Its mission is to advance the interests of the entire commercial real estate industry through advocacy, education, research, standards and information. Find BOMA online at www.boma.org.
Related Stories
Sustainability | Nov 1, 2023
Tool identifies financial incentives for decarbonizing heavy industry, transportation projects
Rocky Mountain Institute (RMI) has released a tool to identify financial incentives to help developers, industrial companies, and investors find financial incentives for heavy industry and transport projects.
Contractors | Nov 1, 2023
Nonresidential construction spending increases for the 16th straight month, in September 2023
National nonresidential construction spending increased 0.3% in September, according to an Associated Builders and Contractors analysis of data published today by the U.S. Census Bureau. On a seasonally adjusted annualized basis, nonresidential spending totaled $1.1 trillion.
Sponsored | MFPRO+ Course | Oct 30, 2023
For the Multifamily Sector, Product Innovations Boost Design and Construction Success
This course covers emerging trends in exterior design and products/systems selection in the low- and mid-rise market-rate and luxury multifamily rental market. Topics include facade design, cladding material trends, fenestration trends/innovations, indoor/outdoor connection, and rooftop spaces.
Giants 400 | Oct 30, 2023
Top 170 K-12 School Architecture Firms for 2023
PBK Architects, Huckabee, DLR Group, VLK Architects, and Stantec top BD+C's ranking of the nation's largest K-12 school building architecture and architecture/engineering (AE) firms for 2023, as reported in Building Design+Construction's 2023 Giants 400 Report.
Giants 400 | Oct 30, 2023
Top 100 K-12 School Construction Firms for 2023
CORE Construction, Gilbane, Balfour Beatty, Skanska USA, and Adolfson & Peterson top BD+C's ranking of the nation's largest K-12 school building contractors and construction management (CM) firms for 2023, as reported in Building Design+Construction's 2023 Giants 400 Report.
Giants 400 | Oct 30, 2023
Top 80 K-12 School Engineering Firms for 2023
AECOM, CMTA, Jacobs, WSP, and IMEG head BD+C's ranking of the nation's largest K-12 school building engineering and engineering/architecture (EA) firms for 2023, as reported in Building Design+Construction's 2023 Giants 400 Report.
MFPRO+ Special Reports | Oct 27, 2023
Download the 2023 Multifamily Annual Report
Welcome to Building Design+Construction and Multifamily Pro+’s first Multifamily Annual Report. This 76-page special report is our first-ever “state of the state” update on the $110 billion multifamily housing construction sector.
Smart Buildings | Oct 27, 2023
Cox Communities partnership levels up smart tech for multifamily customers
Yesterday, Cox Communities announced its partnership with Level Home Inc., a provider of next-generation smart IoT solutions for multifamily customers.
Student Housing | Oct 25, 2023
Pierce Education Properties acquires Penn State student housing
The two communities offer a wide range of amenities, including swimming pools with sun decks, study rooms with complimentary printing services, fitness centers, tennis court, and sand volleyball courts.
Senior Living Design | Oct 19, 2023
Senior living construction poised for steady recovery
Senior housing demand, as measured by the change in occupied units, continued to outpace new supply in the third quarter, according to NIC MAP Vision. It was the ninth consecutive quarter of growth with a net absorption gain. On the supply side, construction starts continued to be limited compared with pre-pandemic levels.


