With an average cost per square foot of $16.11, Stamford, Conn., is the most costly U.S. market for commercial real estate, according to a new study by the Building Owners and Managers Association International. New York and San Francisco are also among the nation's priciest markets.
Using the results from the BOMA 2013 Experience Exchange Report, the group compiled a list of the most and least expensive commercial real estate city-markets in the United States. The annual report aggregates rental income and operating expense figures from the previous year; in 2012, data was gathered from more than 5,300 buildings across 250 markets and 115 cities in the United States and Canada.
Five most expensive city-markets – total operating expenses:
1. Stamford, Conn. $16.11 per square foot (psf)
2. New York $11.80 psf
3. Grand Rapids, Mich. $11.16 psf
4. Newark, N.J. $10.34 psf
5. San Francisco $9.66 psf
Five least expensive city-markets – total operating expenses:
1. Stockton, Calif. $3.57 psf
2. Fresno, Calif. $3.61 psf
3. Huntsville, Ala. $4.31 psf
4. Virginia Beach, Va. $4.64 psf
5. Albuquerque, N.M. $4.80 psf
Total operating expenses incorporate all expenses incurred to operate office buildings, including utilities, repairs and maintenance, roads and grounds, cleaning, administration, and security. Fixed expenses include real estate taxes, property taxes and insurance.
There was a 3.9 percent overall decrease in total operating expenses from 2011 to 2012, underscoring an industry focus on maximizing building efficiency in the face of dwindling income streams. For example, New York, which topped the list of most expensive markets for operating expenses last year, saw a decrease of $0.66 per square foot.
Five most expensive city-markets – total rental income:
1. Washington, D.C. $44.30 psf
2. New York $39.00 psf
3. San Mateo, Calif. $34.96 psf
4. San Francisco $34.49 psf
5. Santa Monica, Calif. $34.04 psf
Five least expensive city-markets – total rental income:
1. Macon, Ga. $8.16 psf
2. Shreveport, La. $11.18 psf
3. Columbus, Ohio $12.09 psf
4. Huntsville, Ala. $12.81 psf
5. Little Rock, Ark. $12.81 psf
Total rental income includes rental income from office, retail and other space, such as storage areas.
While average rental income has dropped somewhat, decreasing 2.9 percent from 2011 to 2012, building owners and managers are compensating for these income losses with greater reductions in expenses.
The Experience Exchange Report is the premier income and expense data benchmarking tool for the commercial real estate industry. The EER allows users to conduct multi-year analysis of single markets and select multiple cities to generate state and regional reports. It also offers the capability to search by building size, height, age and more for broader analysis. Subscriptions are available at www.bomaeer.com.
About BOMA International
The Building Owners and Managers Association (BOMA) International is a federation of 93 BOMA U.S. associations, BOMA Canada and its 11 regional associations and 13 BOMA international affiliates. Founded in 1907, BOMA represents the owners and managers of all commercial property types, including nearly 10 billion square feet of U.S. office space that supports 3.7 million jobs and contributes $205 billion to the U.S. GDP. Its mission is to advance the interests of the entire commercial real estate industry through advocacy, education, research, standards and information. Find BOMA online at www.boma.org.
Related Stories
Transit Facilities | Jun 15, 2023
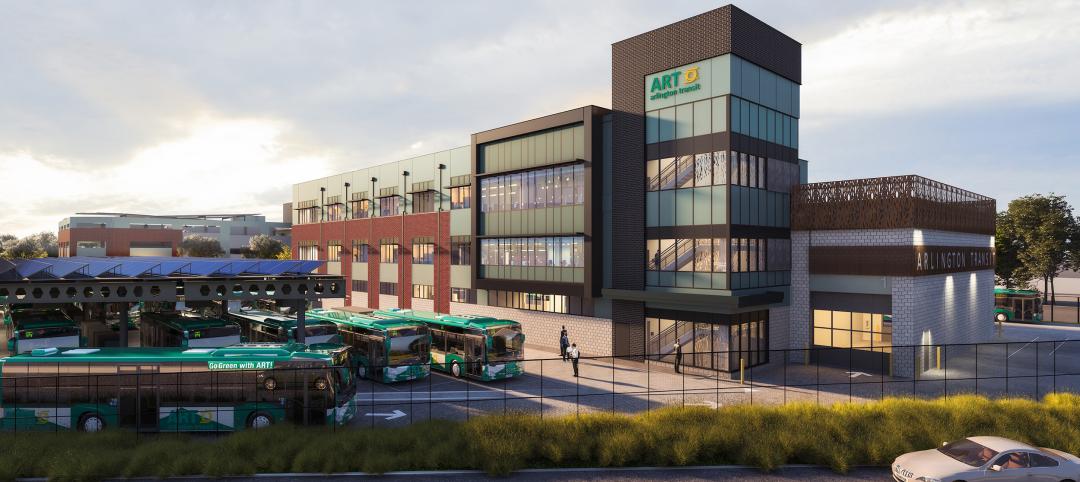
Arlington, Va., transit station will support zero emissions bus fleet
Arlington (Va.) Transit’s new operations and maintenance facility will support a transition of their current bus fleet to Zero Emissions Buses (ZEBs). The facility will reflect a modern industrial design with operational layouts to embrace a functional aesthetic. Intuitive entry points and wayfinding will include biophilic accents.
Urban Planning | Jun 15, 2023
Arizona limits housing projects in Phoenix area over groundwater supply concerns
Arizona will no longer grant certifications for new residential developments in Phoenix, it’s largest city, due to concerns over groundwater supply. The announcement indicates that the Phoenix area, currently the nation’s fastest-growing region in terms of population growth, will not be able to sustain its rapid growth because of limited freshwater resources.
Multifamily Housing | Jun 15, 2023
Alliance of Pittsburgh building owners slashes carbon emissions by 45%
The Pittsburgh 2030 District, an alliance of property owners in the Pittsburgh area, says that it has reduced carbon emissions by 44.8% below baseline. Begun in 2012 under the guidance of the Green Building Alliance (GBA), the Pittsburgh 2030 District encompasses more than 86 million sf of space within 556 buildings.
Industry Research | Jun 15, 2023
Exurbs and emerging suburbs having fastest population growth, says Cushman & Wakefield
Recently released county and metro-level population growth data by the U.S. Census Bureau shows that the fastest growing areas are found in exurbs and emerging suburbs.
Healthcare Facilities | Jun 14, 2023
Design considerations for behavioral health patients
The surrounding environment plays a huge role in the mental state of the occupants of a space, especially behavioral health patients whose perception of safety can be heightened. When patients do not feel comfortable in a space, the relationships between patients and therapists are negatively affected.
Engineers | Jun 14, 2023
The high cost of low maintenance
Walter P Moore’s Javier Balma, PhD, PE, SE, and Webb Wright, PE, identify the primary causes of engineering failures, define proactive versus reactive maintenance, recognize the reasons for deferred maintenance, and identify the financial and safety risks related to deferred maintenance.
University Buildings | Jun 14, 2023
Calif. State University’s new ‘library-plus’ building bridges upper and lower campuses
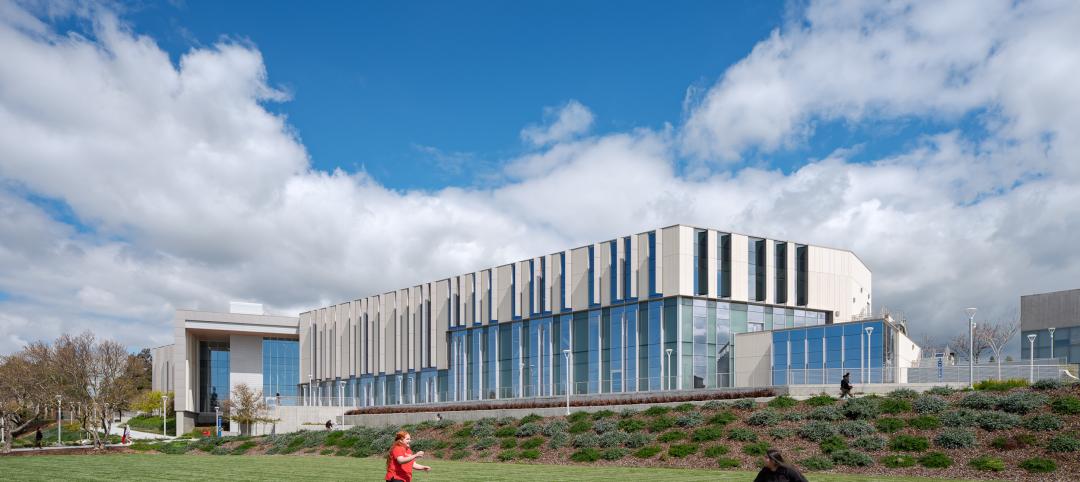
A three-story “library-plus” building at California State University, East Bay (CSUEB) that ties together the upper and lower campuses was recently completed. The 100,977-sf facility, known as the Collaborative Opportunities for Research & Engagement (“CORE”) Building, is one of the busiest libraries in the CSU system. The previous library served 1.2 million visitors annually.
Resiliency | Jun 14, 2023
HUD offers $4.8 billion in funding for green and resilient building retrofit projects
The Department of Housing and Urban Development (HUD) recently released guidelines for its Green and Resilient Retrofit Program (GRRP) that has $4.8 billion for funding green projects.
Arenas | Jun 14, 2023
A multipurpose arena helps revitalize a historic African American community in Georgia
In Savannah, Ga., Enmarket Arena, a multipurpose arena that opened last year, has helped revitalize the city’s historic Canal District—home to a largely African American community that has been historically separated from the rest of downtown.
Building Materials | Jun 14, 2023
Construction input prices fall 0.6% in May 2023
Construction input prices fell 0.6% in May compared to the previous month, according to an Associated Builders and Contractors analysis of the U.S. Bureau of Labor Statistics’ Producer Price Index data released today. Nonresidential construction input prices declined 0.5% for the month.


