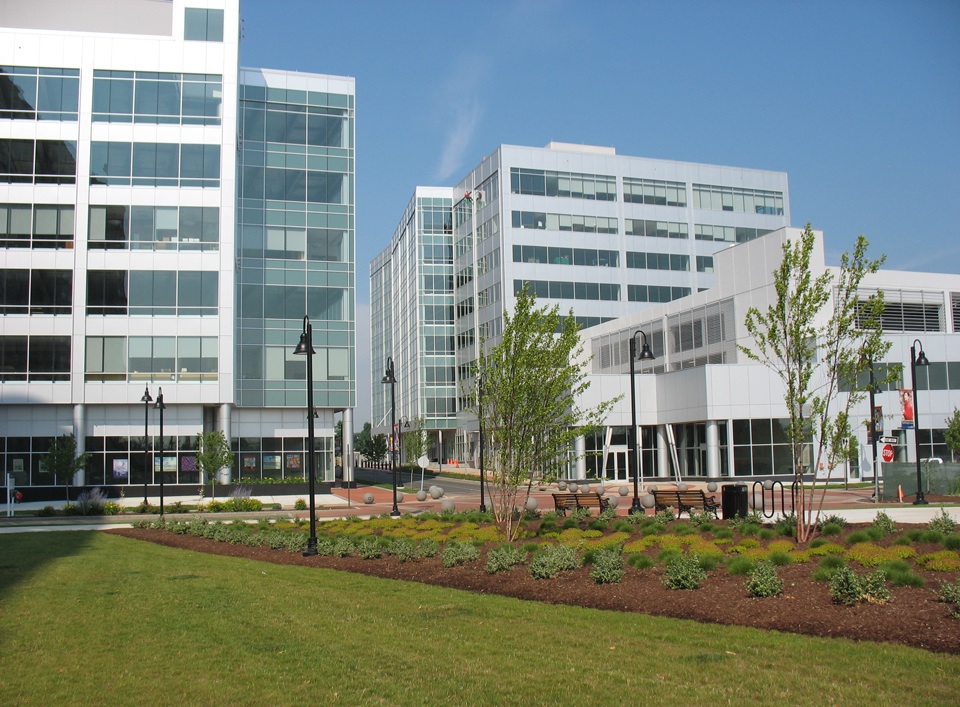
With an average cost per square foot of $16.11, Stamford, Conn., is the most costly U.S. market for commercial real estate, according to a new study by the Building Owners and Managers Association International. New York and San Francisco are also among the nation's priciest markets.
Using the results from the BOMA 2013 Experience Exchange Report, the group compiled a list of the most and least expensive commercial real estate city-markets in the United States. The annual report aggregates rental income and operating expense figures from the previous year; in 2012, data was gathered from more than 5,300 buildings across 250 markets and 115 cities in the United States and Canada.
Five most expensive city-markets – total operating expenses:
1. Stamford, Conn. $16.11 per square foot (psf)
2. New York $11.80 psf
3. Grand Rapids, Mich. $11.16 psf
4. Newark, N.J. $10.34 psf
5. San Francisco $9.66 psf
Five least expensive city-markets – total operating expenses:
1. Stockton, Calif. $3.57 psf
2. Fresno, Calif. $3.61 psf
3. Huntsville, Ala. $4.31 psf
4. Virginia Beach, Va. $4.64 psf
5. Albuquerque, N.M. $4.80 psf
Total operating expenses incorporate all expenses incurred to operate office buildings, including utilities, repairs and maintenance, roads and grounds, cleaning, administration, and security. Fixed expenses include real estate taxes, property taxes and insurance.
There was a 3.9 percent overall decrease in total operating expenses from 2011 to 2012, underscoring an industry focus on maximizing building efficiency in the face of dwindling income streams. For example, New York, which topped the list of most expensive markets for operating expenses last year, saw a decrease of $0.66 per square foot.
Five most expensive city-markets – total rental income:
1. Washington, D.C. $44.30 psf
2. New York $39.00 psf
3. San Mateo, Calif. $34.96 psf
4. San Francisco $34.49 psf
5. Santa Monica, Calif. $34.04 psf
Five least expensive city-markets – total rental income:
1. Macon, Ga. $8.16 psf
2. Shreveport, La. $11.18 psf
3. Columbus, Ohio $12.09 psf
4. Huntsville, Ala. $12.81 psf
5. Little Rock, Ark. $12.81 psf
Total rental income includes rental income from office, retail and other space, such as storage areas.
While average rental income has dropped somewhat, decreasing 2.9 percent from 2011 to 2012, building owners and managers are compensating for these income losses with greater reductions in expenses.
The Experience Exchange Report is the premier income and expense data benchmarking tool for the commercial real estate industry. The EER allows users to conduct multi-year analysis of single markets and select multiple cities to generate state and regional reports. It also offers the capability to search by building size, height, age and more for broader analysis. Subscriptions are available at www.bomaeer.com.
About BOMA International
The Building Owners and Managers Association (BOMA) International is a federation of 93 BOMA U.S. associations, BOMA Canada and its 11 regional associations and 13 BOMA international affiliates. Founded in 1907, BOMA represents the owners and managers of all commercial property types, including nearly 10 billion square feet of U.S. office space that supports 3.7 million jobs and contributes $205 billion to the U.S. GDP. Its mission is to advance the interests of the entire commercial real estate industry through advocacy, education, research, standards and information. Find BOMA online at www.boma.org.
Related Stories
Contractors | Dec 6, 2022
Slow payments cost the construction industry $208 billion in 2022
The cost of floating payments for wages and invoices represents $208 billion in excess cost to the construction industry, a 53% increase from 2021, according to a survey by Rabbet, a provider of construction finance software.
Mixed-Use | Dec 6, 2022
Houston developer plans to convert Kevin Roche-designed ConocoPhillips HQ to mixed-use destination
Houston-based Midway, a real estate investment, development, and management firm, plans to redevelop the former ConocoPhillips corporate headquarters site into a mixed-use destination called Watermark District at Woodcreek.
Office Buildings | Dec 5, 2022
How to foster collaboration and inspiration for a workplace culture that does not exist (yet)
A building might not be able to “hack” innovation, but it can create the right conditions to foster connection and innovation, write GBBN's Chad Burke and Zachary Zettler.
University Buildings | Dec 5, 2022
Florida Polytechnic University unveils its Applied Research Center, furthering its mission to provide STEM education
In Lakeland, Fla., located between Orlando and Tampa, Florida Polytechnic University unveiled its new Applied Research Center (ARC). Designed by HOK and built by Skanska, the 90,000-sf academic building houses research and teaching laboratories, student design spaces, conference rooms, and faculty offices—furthering the school’s science, technology, engineering, and mathematics (STEM) mission.
Mass Timber | Dec 1, 2022
Cross laminated timber market forecast to more than triple by end of decade
Cross laminated timber (CLT) is gaining acceptance as an eco-friendly building material, a trend that will propel its growth through the end of the 2020s. The CLT market is projected to more than triple from $1.11 billion in 2021 to $3.72 billion by 2030, according to a report from Polaris Market Research.
75 Top Building Products | Nov 30, 2022
75 top building products for 2022
Each year, the Building Design+Construction editorial team evaluates the vast universe of new and updated products, materials, and systems for the U.S. building design and construction market. The best-of-the-best products make up our annual 75 Top Products report.
K-12 Schools | Nov 30, 2022
School districts are prioritizing federal funds for air filtration, HVAC upgrades
U.S. school districts are widely planning to use funds from last year’s American Rescue Plan (ARP) to upgrade or improve air filtration and heating/cooling systems, according to a report from the Center for Green Schools at the U.S. Green Building Council. The report, “School Facilities Funding in the Pandemic,” says air filtration and HVAC upgrades are the top facility improvement choice for the 5,004 school districts included in the analysis.
Retail Centers | Nov 29, 2022
'Social' tenants play a vital role in the health of the retail center market
After a long Covid-induced period when the public avoided large gatherings, owners of malls and retail lifestyle centers are increasingly focused on attracting tenants that provide opportunities for socialization. Pent-up demand for experiences involving gatherings of people is fueling renovations and redesigns of large retail developments.
Legislation | Nov 23, 2022
7 ways the Inflation Reduction Act will impact the building sector
HOK’s Anica Landreneau and Stephanie Miller and Smart Surfaces Coalition’s Greg Kats reveal multiple ways the IRA will benefit the built environment.
Multifamily Housing | Nov 22, 2022
10 compelling multifamily developments debut in 2022
A smart home tech-focused apartment complex in North Phoenix, Ariz., and a factory conversion to lofts in St. Louis highlight the notable multifamily developments to debut recently.


