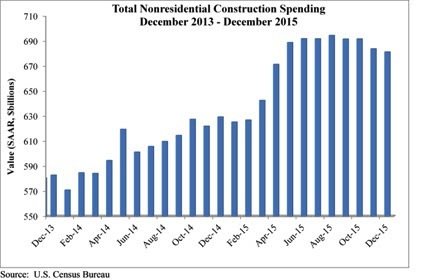
Nonresidential construction spending crested the $700 billion mark on a seasonally adjusted annualized basis in January for the first time since March 2009, according to analysis of U.S. Census Bureau data released today by Associated Builders and Contractors (ABC).
Nonresidential construction spending expanded 2.5% on a monthly basis and 12.3% on a yearly basis, totaling $701.9 billion. The Census Bureau upwardly revised December's estimate from $681.2 billion to $684.5 billion, though they downgraded November's figure from $683.7 to $680.5 million. Private nonresidential construction spending increased by 1% for the month, while its public counterpart expanded by 4.6%.
"After several months of relatively weak nonresidential construction spending data, today's data release was most welcome," ABC Chief Economist Anirban Basu said. "While January is a difficult month to interpret and one that should not be overly emphasized, the fact of the matter is that the year-over-year performance in spending is consistent with a host of industry indicators. For many months, the average contractor has been reporting decent backlog. Measures of industry confidence have remained stable even in the face of adverse news coming from various parts of the world.
"While the nonresidential construction spending recovery appears to remain in place, the industry's overall outlook remains murky," Basu said. "The global economy remains weak, and domestic corporate profitability has been slipping. The U.S. economic recovery continues to be under-diversified, with consumers continuing to lead the way. If corporate profitability continues to struggle, given falling exports and a general lack of confidence among CEOs, the pace of employment growth will slow over the course of 2016. That will presumably affect consumer spending, which is already being hampered by rising health care costs. That, in turn, could jeopardize the ongoing economic recovery, now on its way to completing its seventh year."
Spending increased in January on a monthly basis in 10 of 16 nonresidential construction sectors:
- Spending in the highway and street category expanded 14.6% from December 2015 and is 33.9 higher than in January 2015.
- Sewage and waste disposal-related spending expanded 4% for the month and 1.4% from the same time last year.
- Spending in the amusement and recreation category climbed 0.7% on a monthly basis and 16.9% on a year-over-year basis.
- Conservation and development-related spending is 10% higher on a monthly basis and 1.6% higher on a yearly basis.
- Lodging-related spending is up 6.3% for the month and is up 34.8% on a year-ago basis.
- Spending in the religious category grew 4.2% for the month and 0.2% from January 2015.
- Manufacturing-related spending expanded 4.2% on a monthly basis and is up 11.3% on a yearly basis.
- Spending in the power category expanded 2.9% from December 2015 and is 8.1% higher than in January 2015.
- Water supply-related spending expanded 2% on a monthly basis but fell 7.9% on a yearly basis.
- Spending in the office category grew 0.2% from December 2015 and is up 19.6% from January 2015.
Spending in six of the nonresidential construction subsectors fell in January on a monthly basis:
- Commercial-related construction spending fell 4.3% for the month but grew 0.8% on a year-over-year basis.
- Educational-related construction spending fell 1.1% on a monthly basis, but expanded 12.1% on a yearly basis.
- Transportation-related spending fell 2.5% month-over-month, but expanded 0.6% year-over-year.
- Health care-related spending fell 0.1% month-over-month but is up 1.8% year-over-year.
- Public safety-related spending is down 1.5% for the month and 3.2% from the same time one year ago.
- Communication-related spending fell by 4.2% month-over-month but expanded 27.2% year-over-year.
Related Stories
Market Data | Feb 19, 2020
Architecture billings continue growth into 2020
Demand for design services increases across all building sectors.
Market Data | Feb 5, 2020
Construction employment increases in 211 out of 358 metro areas from December 2018 to 2019
Dallas-Plano-Irving, Texas and Kansas City have largest gains; New York City and Fairbanks, Alaska lag the most as labor shortages likely kept firms in many areas from adding even more workers.
Market Data | Feb 4, 2020
Construction spending dips in December as nonresidential losses offset housing pickup
Homebuilding strengthens but infrastructure and other nonresidential spending fades in recent months, reversing pattern in early 2019.
Market Data | Feb 4, 2020
IMEG Corp. acquires Clark Engineering
Founded in 1938 in Minneapolis, Clark Engineering has an extensive history of public and private project experience.
Market Data | Jan 30, 2020
U.S. economy expands 2.1% in 4th quarter
Investment in structures contracts.
Market Data | Jan 30, 2020
US construction & real estate industry sees a drop of 30.4% in deal activity in December 2019
A total of 48 deals worth $505.11m were announced in December 2019.
Market Data | Jan 29, 2020
Navigant research report finds global wind capacity value is expected to increase tenfold over the next decade
Wind power is being developed in more countries as well as offshore and onshore.
Market Data | Jan 28, 2020
What eight leading economists predict for nonresidential construction in 2020 and 2021
Public safety, education, and healthcare highlight a market that is entering growth-slowdown mode, but no downturn is projected, according to AIA's latest Consensus Construction Forecast panel.
Market Data | Jan 28, 2020
Los Angeles has the largest hotel construction pipeline in the United States
Los Angeles will have a growth rate of 2.5% with 19 new hotels/2,589 rooms opening.
Market Data | Jan 27, 2020
U.S. hotel construction pipeline finishes 2019 trending upward
Projects under construction continue to rise reaching an all-time high of 1,768 projects.


