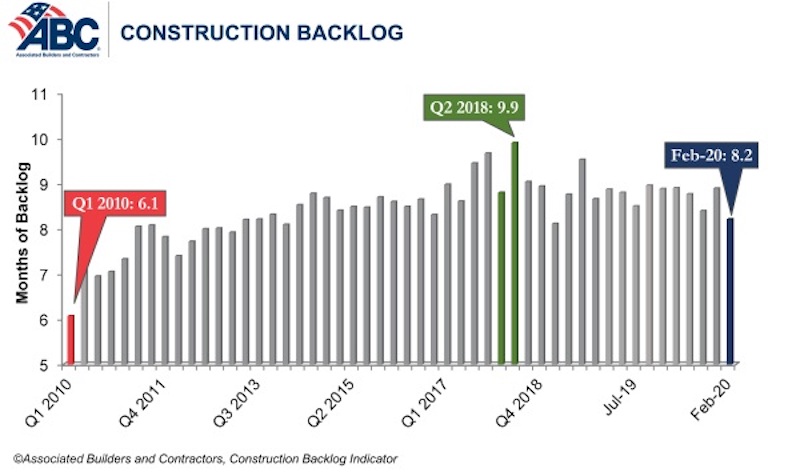
Associated Builders and Contractors reported today that its Construction Backlog Indicator fell to 8.2 months in February, a 7.7% decrease from January’s reading. Backlog for firms working in the infrastructure segment rose by 1.3 months in February while backlog for commercial and institutional and heavy industrial firms declined by 0.6 months and 0.7 months, respectively.
“The impact of the pandemic on backlog was immediate,” said ABC Chief Economist Anirban Basu. “While financial markets, the National Basketball Association and other elements of American society didn’t respond meaningfully to the emerging crisis until early-March, those who consume construction services appear to have begun responding to the crisis in February, resulting in a significant decline in backlog in commercial and industrial segments. Declining backlog was registered in every region of the country with the exception of the Middle States, where social distancing directives were implemented at a slower rate.
“Backlog is likely to decline further,” said Basu. “Many economic actors are striving to preserve as much liquidity as possible, inducing them into postponing construction projects or perhaps canceling them altogether. While infrastructure-related backlog expanded in February, this is unlikely to persist, as the crisis has crushed the finances of many state and local governments. These governments will complete their current fiscal year with substantial shortfalls—shortfalls that must be addressed during the next fiscal year absent significant additional financial assistance from the federal government.”
Related Stories
Market Data | Jul 18, 2019
Construction contractors remain confident as summer begins
Contractors were slightly less upbeat regarding profit margins and staffing levels compared to April.
Market Data | Jul 17, 2019
Design services demand stalled in June
Project inquiry gains hit a 10-year low.
Market Data | Jul 16, 2019
ABC’s Construction Backlog Indicator increases modestly in May
The Construction Backlog Indicator expanded to 8.9 months in May 2019.
K-12 Schools | Jul 15, 2019
Summer assignments: 2019 K-12 school construction costs
Using RSMeans data from Gordian, here are the most recent costs per square foot for K-12 school buildings in 10 cities across the U.S.
Market Data | Jul 12, 2019
Construction input prices plummet in June
This is the first time in nearly three years that input prices have fallen on a year-over-year basis.
Market Data | Jul 1, 2019
Nonresidential construction spending slips modestly in May
Among the 16 nonresidential construction spending categories tracked by the Census Bureau, five experienced increases in monthly spending.
Market Data | Jul 1, 2019
Almost 60% of the U.S. construction project pipeline value is concentrated in 10 major states
With a total of 1,302 projects worth $524.6 billion, California has both the largest number and value of projects in the U.S. construction project pipeline.
Market Data | Jun 21, 2019
Architecture billings remain flat
AIA’s Architecture Billings Index (ABI) score for May showed a small increase in design services at 50.2.
Market Data | Jun 19, 2019
Number of U.S. architects continues to rise
New data from NCARB reveals that the number of architects continues to increase.
Market Data | Jun 12, 2019
Construction input prices see slight increase in May
Among the 11 subcategories, six saw prices fall last month, with the largest decreases in natural gas.


