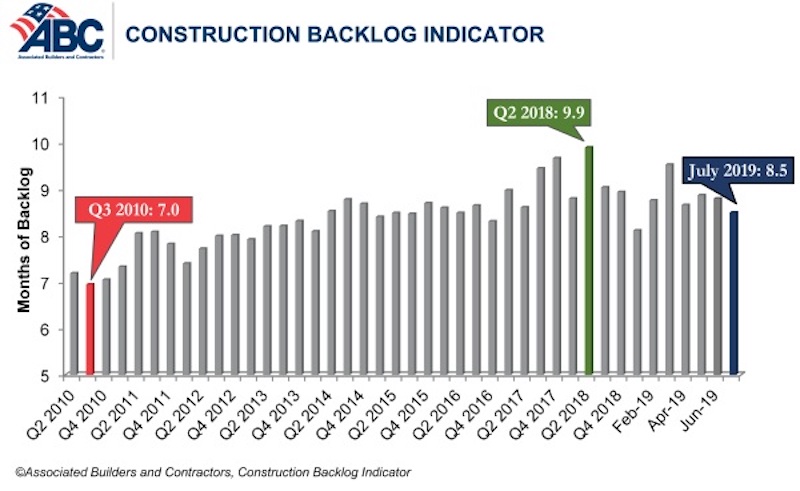
Associated Builders and Contractors reported today that its Construction Backlog Indicator fell to 8.5 months in July 2019, down 0.3 months or 2.9% from June 2019, when CBI stood at 8.8 months.
“Construction backlog declined in all four major regions in July,” said ABC Chief Economist Anirban Basu. “While the Northeast and South—the regions with the lengthiest backlog—experienced minor dips, the West and the Middle States exhibited more significant declines. Despite the 9.3% monthly decline in the West region, backlog remains above levels observed in early 2019. For the Middle States, however, backlog is at its lowest level since the last quarter of 2015, largely due to a dip in activity in the commercial/institutional segment, the largest segment represented in ABC’s survey.
“Among the three industry subsegments measured by CBI, only the commercial/institutional category experienced a backlog decrease in July 2019,” said Basu. “Backlog in the heavy industrial category increased by 2.3 months and now stands at its highest level in the history of the CBI series. This is largely attributable to the energy sector, with particular strength apparent in the South. Regions tied to traditional manufacturing activities did not fare as well in July.
“Only companies with revenues lower than $30 million per year experienced shorter backlog in July,” said Basu. “This may be cause for concern since smaller firms tend to be more vulnerable to economic fluctuations. Much of the decline in backlog among this group occurred among those specializing in commercial construction.
“Despite the recent, albeit brief, losing streak, backlog levels remain consistent with healthy construction activity over the near-term,” said Basu. “Contractors collectively expect rising sales to continue and are planning to add to staffing levels, though their exuberance has been somewhat tempered in recent months. If the U.S. economy continues to soften, including in the nation’s manufacturing industry, contractor confidence levels will likely continue to subside along with backlog. Yet, for now, the nation’s nonresidential construction segment remains busy.”


Related Stories
Market Data | Dec 2, 2020
Nonresidential construction spending remains flat in October
Residential construction expands as many commercial projects languish.
Market Data | Nov 30, 2020
New FEMA study projects implementing I-Codes could save $600 billion by 2060
International Code Council and FLASH celebrate the most comprehensive study conducted around hazard-resilient building codes to-date.
Market Data | Nov 23, 2020
Construction employment is down in three-fourths of states since February
This news comes even after 36 states added construction jobs in October.
Market Data | Nov 18, 2020
Architecture billings remained stalled in October
The pace of decline during October remained at about the same level as in September.
Market Data | Nov 17, 2020
Architects face data, culture gaps in fighting climate change
New study outlines how building product manufacturers can best support architects in climate action.
Market Data | Nov 10, 2020
Construction association ready to work with president-elect Biden to prepare significant new infrastructure and recovery measures
Incoming president and congress should focus on enacting measures to rebuild infrastructure and revive the economy.
Market Data | Nov 9, 2020
Construction sector adds 84,000 workers in October
A growing number of project cancellations risks undermining future industry job gains.
Market Data | Nov 4, 2020
Drop in nonresidential construction offsets most residential spending gains as growing number of contractors report cancelled projects
Association officials warn that demand for nonresidential construction will slide further without new federal relief measures.
Market Data | Nov 2, 2020
Nonresidential construction spending declines further in September
Among the sixteen nonresidential subcategories, thirteen were down on a monthly basis.
Market Data | Nov 2, 2020
A white paper assesses seniors’ access to livable communities
The Joint Center for Housing Studies and AARP’s Public Policy Institute connect livability with income, race, and housing costs.


