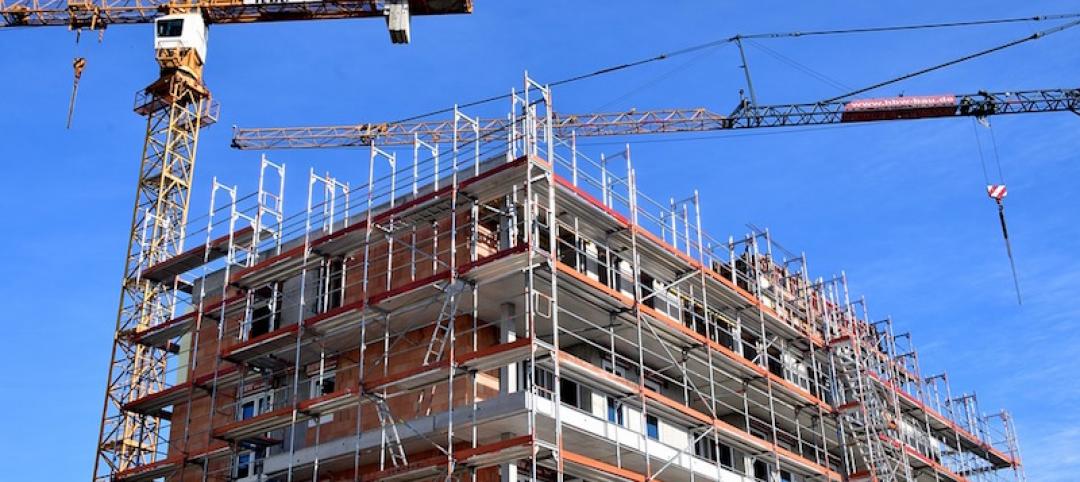
Nearly one-third of architecture, engineering and construction (A/E/C) firms have furloughed or laid off employees due to COVID-19, and more than 90% say they have experienced at least some project delays or cancellations, according to a new survey of firm leaders conducted by PSMJ Resources. In general, however, the industry has weathered the crisis better than most. The survey also found that less than 5% of responding firms suffered “significant” staff reductions, and under 15% said that their project delays and cancellations were “major” as opposed to moderate or minor.
The data is from a new monthly supplement to PSMJ’s Quarterly Market Forecast (QMF) survey of A/E/C firms. The QMF, produced quarterly by PSMJ since 2003, measures proposal activity overall and for a variety of markets and submarkets served by A/E/C firms. The August results for proposal opportunities suggest that the bleeding has stopped and the industry’s recovery is well underway. After reaching lows in the 2nd Quarter unseen since the Great Recession, proposal activity rebounded in July and August, overall and across most market sectors.
"The A/E/C Industry has fared much better than most industries during the Covid-19 pandemic. In fact, many firms are reporting their best year ever,” says PSMJ Senior Principal David Burstein, P.E., AECPM. “The Paycheck Protection loan program designed to limit staff reductions has certainly helped keep layoffs down to about 5% of the industry workforce, and hiring has been accelerating for the past three months. At the same time, proposal activity has returned to a level where the number of firms reporting growth in opportunities is equal to or slightly higher than those saying proposal activity is down."
Quarterly Market Forecast Supplement– COVID’s Impact on Layoffs through March vs. August
Earlier data on the effects of COVID, collected by PSMJ as part of its 1st Quarter QMF survey, found that fewer than one of every five firms had conducted layoffs by the end of March, while a percentage of firms that had experienced no project delays or cancellations fell from 12.4% in March to 8.4% in August
Quarterly Market Forecast Supplement– COVID’s Impact on Projects through March vs. August
After bottoming out at -41% in April and -22% for the 2nd Quarter, the QMF’s Net Plus/Minus Index (NPMI) for overall proposal activity improved to +2% in July and stayed relatively level at +1% in August. PSMJ’s NPMI represents the difference between the percentage of firms reporting an increase in proposal activity and those reporting a decrease for the subject period. For August, 33.1% of respondents said they saw increased proposal activity compared with 31.8% who reported a decrease. The remainder said proposal activity was about the same from July to August.
Among the 12 markets measured, healthcare returned to the top spot with an NPMI of +31% after slipping in the 2nd Quarter. It was followed by Energy/Utilities (29%) and a surging Housing market (27%). Water/Wastewater (20%) continues to be solid amid the COVID crisis, while Heavy Industry and Environmental (both 9%) rounded out the Top 6. Education (-29%) remains a troubled market, tied for second-worst with Commercial Developers and trailing only Commercial Users (-36%).
PSMJ has been using the QMF as a measure of the design and construction industry’s health every quarter for the past 17 years, assessing the results overall and across 12 major markets and 58 submarkets. The company chose proposal activity because it represents one of the earliest stages of the project lifecycle. A consistent group of over 300 firm leaders participate, including 155 responding for the August supplement.
Related Stories
Market Data | May 2, 2018
Construction employment increases in 245 metro areas between March 2017 & 2018, as trade fights & infrastructure funding shortfalls loom
Houston-The Woodlands-Sugar Land, Texas and Weirton-Steubenville, W.Va.-Ohio experience largest year-over-year gains; Baton Rouge, La. and Auburn-Opelika, Ala. have biggest annual declines.
Market Data | May 2, 2018
Nonresidential Construction down in March, private sector falters, public sector unchanged
February’s spending estimate was revised roughly $10 billion higher.
Market Data | Apr 30, 2018
Outlook mixed for renewable energy installations in Middle East and Africa region
Several major MEA countries are actively supporting the growth of renewable energy.
Market Data | Apr 12, 2018
Construction costs climb in March as wide range of input costs jump
Association officials urge Trump administration, congress to fund infrastructure adequately as better way to stimulate demand than tariffs that impose steep costs on contractors and project owners.
Market Data | Apr 9, 2018
Construction employers add 228,000 jobs over the year despite dip in March
Average hourly earnings increase to $29.43 in construction, topping private sector by nearly 10%; Association officials urge updating and better funding programs to train workers for construction jobs.
Market Data | Apr 4, 2018
Construction employment increases in 257 metro areas between February 2017 & 2018 as construction firms continue to expand amid strong demand
Riverside-San Bernardino-Ontario, Calif. and Merced, Calif. experience largest year-over-year gains; Baton Rouge, La. and Auburn-Opelika, Ala. have biggest annual declines in construction employment.
Market Data | Apr 2, 2018
Construction spending in February inches up from January
Association officials urge federal, state and local officials to work quickly to put recently enacted funding increases to work to improve aging and over-burdened infrastructure, offset public-sector spending drops.
Market Data | Mar 29, 2018
AIA and the University of Minnesota partner to develop Guides for Equitable Practice
The Guides for Equitable Practice will be developed and implemented in three phase.
Market Data | Mar 22, 2018
Architecture billings continue to hold positive in 2018
Billings particularly strong at firms in the West and Midwest regions.
Market Data | Mar 21, 2018
Construction employment increases in 248 metro areas as new metal tariffs threaten future sector job gains
Riverside-San Bernardino-Ontario, Calif., and Merced, Calif., experience largest year-over-year gains; Baton Rouge, La., and Auburn-Opelika, Ala., have biggest annual declines in construction employment.


