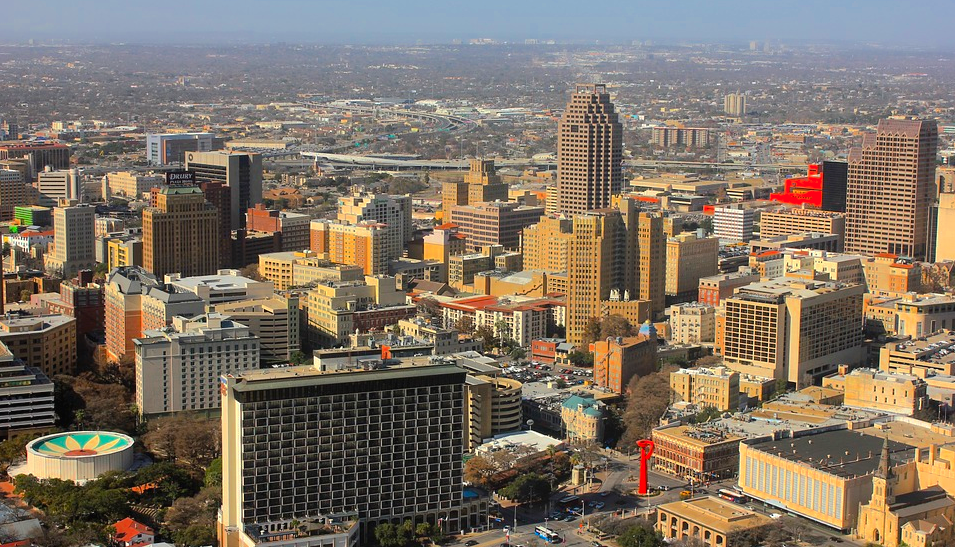
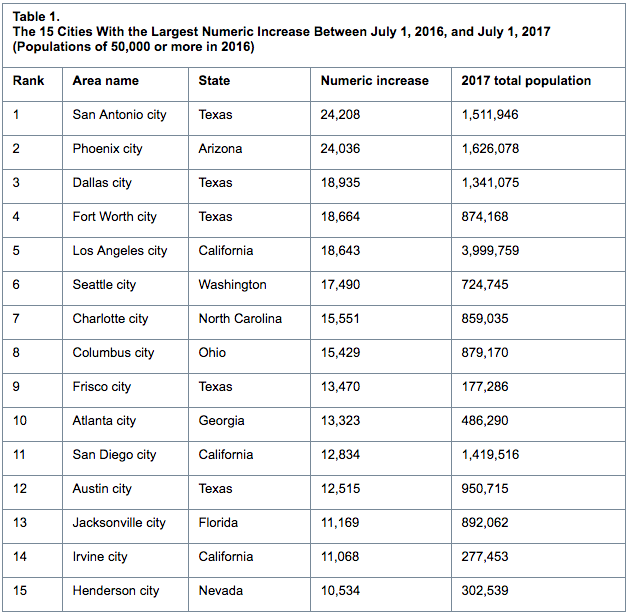
Eight of the 15 cities or towns with the largest population gains were located in the South in 2017, with three of the top five in Texas, according to new population estimates released by the U.S. Census Bureau.
“San Antonio, Texas, tops the list with the largest population gain with an increase of over 24,200 people, an average of 66 people per day between 2016 and 2017,” said Amel Toukabri, a demographer in the Population Division of the Census Bureau. “That’s a growth rate of 1.6%. This growth was enough to push San Antonio's population above the 1.5 million mark.”
Some of the other cities with the largest population gains were Phoenix, Ariz. (24,000); Dallas, Texas (18,900); Fort Worth, Texas (18,700); Los Angeles, Calif. (18,600); Seattle, Washington (17,500); and Charlotte, N.C. (15,600).
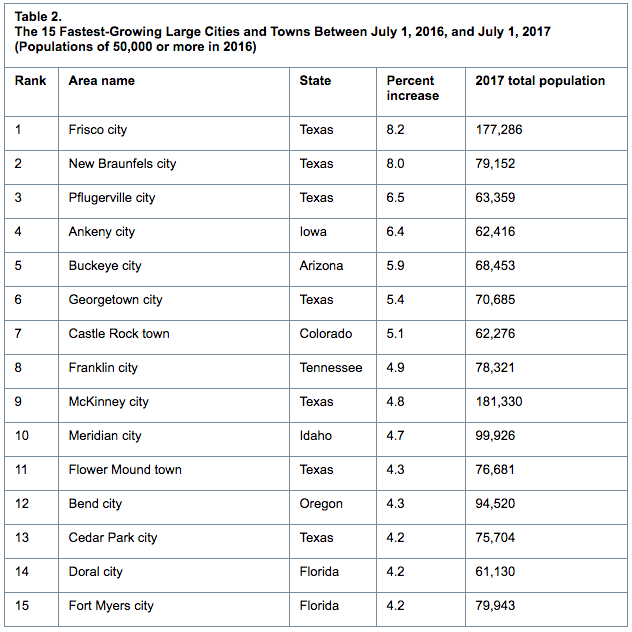
Regarding percentage change in population, 10 of the 15 fastest-growing large cities were located in the South, with seven in Texas. Between 2016 and 2017, Frisco, Texas (near Dallas), was the fastest-growing large city (population of 50,000 or more) at 8.2%, making its growth rate more than 11 times faster than the nation’s growth rate of 0.7%.
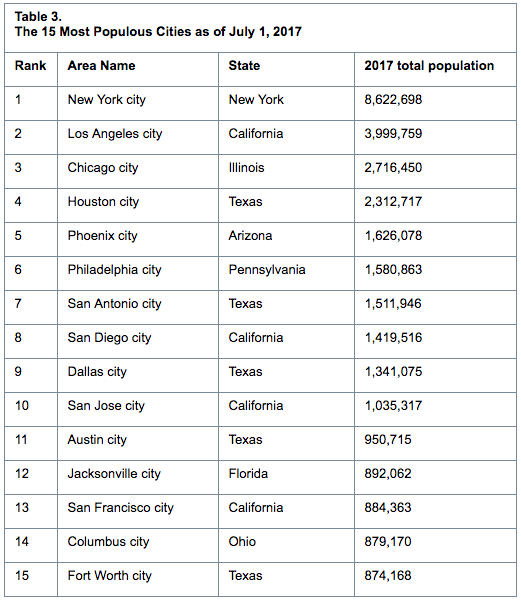
Fort Worth, Texas, surpassed Indianapolis, Ind., becoming the 15th largest city in the United States with a population of 874,168. Indianapolis has a population of 863,002. The 14 largest U.S.cities have not changed since 2016.
 Source: U.S. Census Bureau
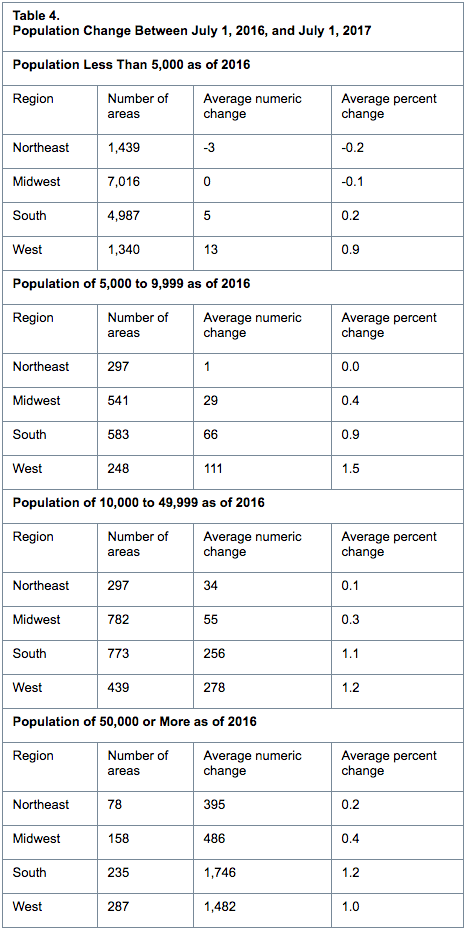
While the main focus of this release has been on the 3.9% of cities with populations of 50,000 or more, the United States is a nation of small towns. Of the nation’s 325.7 million people, an estimated 205.0 million (62.9%) live within an incorporated place as of July 1, 2017. Of approximately 19,500 incorporated places, about 76% had fewer than 5,000 people and nearly 50% had fewer than 1,000 people.
Regional Growth
The West had the highest share of its population living within an incorporated place (76.7%), followed by the Midwest (71.4%) as of July 1, 2017. The Northeast had the smallest population of its residents living in incorporated places (51.4%).
The South had the most city dwellers of any region at 67.9 million. However, this accounted for only 54.9% of the South’s 123.7 million total population. Since the 2010 Census, large cities in the South and West have led the nation in population growth, with an average increase of 10.0% (16,206) and 7.8% (12,256), respectively. By comparison, those in the Northeast and Midwest grew on average by 2.2% (9,104) and 3.0% (3,942), respectively.
The nation’s housing stock grew by more than one million last year, reaching over 137 million units. The growth rate of 0.8% from 2016 to 2017 was slower than the 1.4% a decade ago between 2006 and 2007.
 Source: U.S. Census Bureau
Housing unit growth last year remained below 2007 levels in nearly all states except North Dakota (up 1.0% last year, compared to a 0.9% increase in 2007); the District of Columbia (up 1.1%, compared to a 0.9% increase in 2007); South Dakota (up 1.4%, compared to a 1.2% increase in 2007); Iowa (up 0.9%, compared to a 0.7% increase in 2007); and Nebraska (returned to the 2007 growth rate of 0.8%).
Between July 1, 2016, and July 1, 2017, Utah was the fastest-growing state in terms of housing units, with an increase of 2.1%. Idaho and Colorado were the second- and third-fastest growing states with increases of 1.7% and 1.6%, respectively. West Virginia and Rhode Island were tied as the slowest-growing states with increases of 0.2%.
The nation’s housing stock increased by 5.7 million units (4.3%) since April 1, 2010. North Dakota was the fastest-growing state in terms of housing units, with an increase of 18.0% during the same period. Rounding out the top five states in percent gain were Utah (10.7%), Texas (9.6%), Idaho (8.1%) and South Dakota (8.0%).
Fourteen states added more than 100,000 housing units between April 1, 2010, and July 1, 2017. In terms of the largest numeric increase, the top five were Texas (955,000), California (497,000), Florida (452,000), North Carolina (295,000) and New York (219,000).
 Source: U.S. Census Bureau
 Source: U.S. Census Bureau
Related Stories
Market Data | Sep 20, 2021
August construction employment lags pre-pandemic peak in 39 states
The coronavirus delta variant and supply problems hold back recovery.
Market Data | Sep 15, 2021
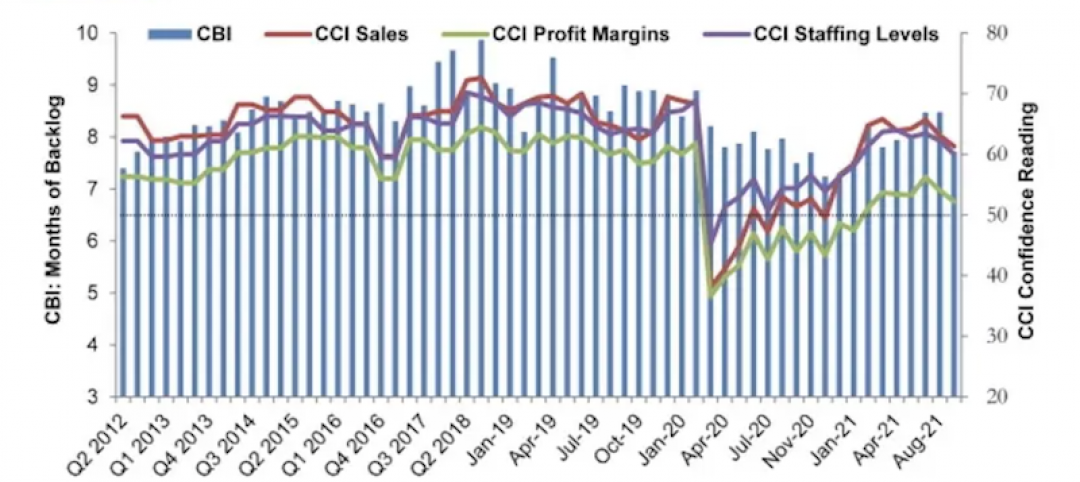
ABC’s Construction Backlog Indicator plummets in August; Contractor Confidence down
ABC’s Construction Confidence Index readings for sales, profit margins and staffing levels all fell modestly in August.
Market Data | Sep 7, 2021
Construction sheds 3,000 jobs in August
Gains are limited to homebuilding as other contractors struggle to fill both craft and salaried positions.
Market Data | Sep 3, 2021
Construction workforce shortages reach pre-pandemic levels
Coronavirus continues to impact projects and disrupt supply chains.
Multifamily Housing | Sep 1, 2021
Top 10 outdoor amenities at multifamily housing developments for 2021
Fire pits, lounge areas, and covered parking are the most common outdoor amenities at multifamily housing developments, according to new research from Multifamily Design+Construction.
Market Data | Sep 1, 2021
Construction spending posts small increase in July
Coronavirus, soaring costs, and supply disruptions threaten to erase further gains.
Market Data | Sep 1, 2021
Bradley Corp. survey finds office workers taking coronavirus precautions
Due to the rise in new strains of the virus, 70% of office workers have implemented a more rigorous handwashing regimen versus 59% of the general population.
Market Data | Aug 31, 2021
Three out of four metro areas add construction jobs from July 2020 to July 2021
COVID, rising costs, and supply chain woes may stall gains.
Market Data | Aug 24, 2021
July construction employment lags pre-pandemic peak in 36 states
Delta variant of coronavirus threatens to hold down further gains.
Market Data | Aug 17, 2021
Demand for design activity continues to expand
The ABI score for July was 54.6.


