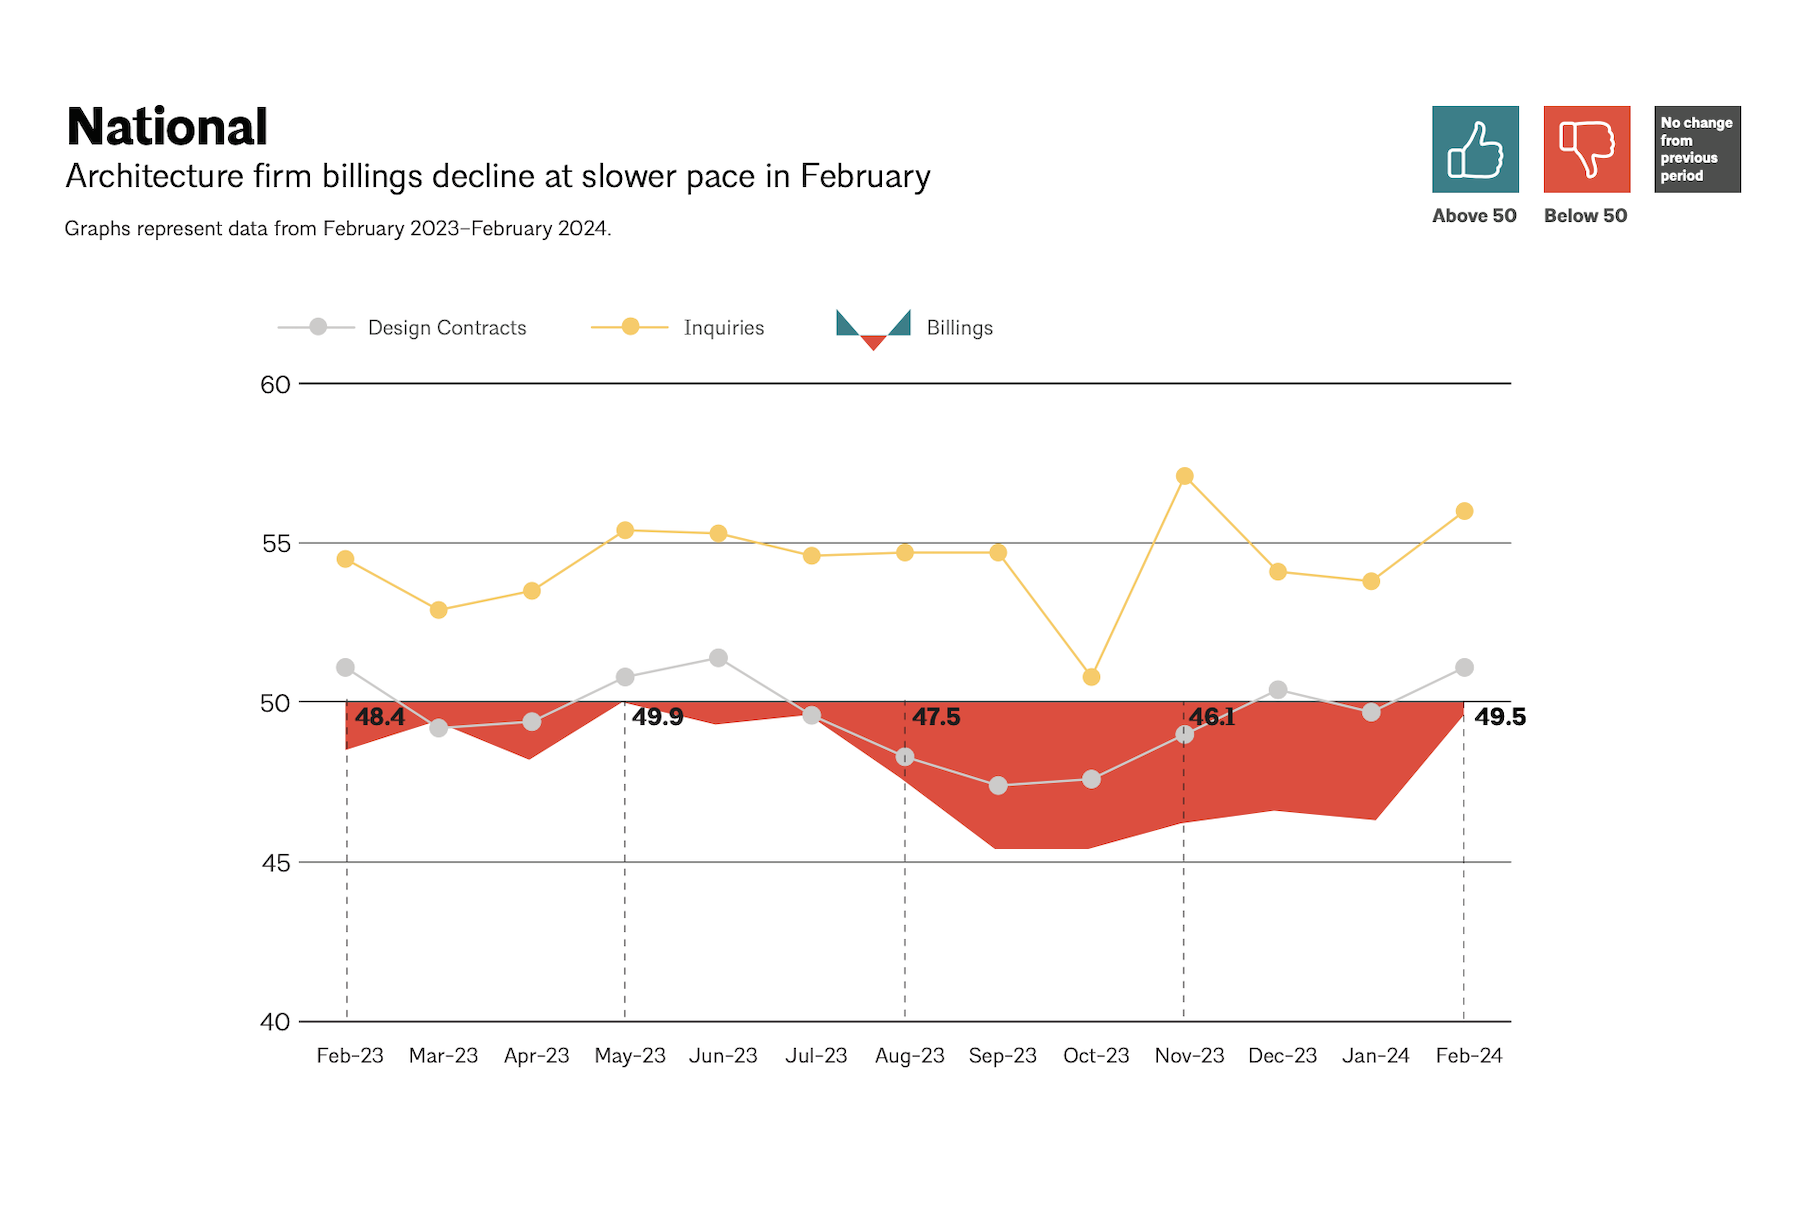
Architecture firm billings continued to decline in February, with an AIA/Deltek Architecture Billings Index (ABI) score of 49.5 for the month. However, February’s score marks the most modest easing in billings since July 2023 and suggests that the recent slowdown may be receding.
“There are indicators this month that business conditions at firms may finally begin to pick up in the coming months. Inquiries into new projects grew at their fastest pace since November, and the value of newly signed design contracts increased at their fastest pace since last summer,” said Kermit Baker, PhD, AIA Chief Economist." Given the moderation of inflation for construction costs and prospects for lower interest rates in the coming months, there are positive signs for future growth.”
The Midwest as a region is still reporting billings growth, despite business conditions remaining weak across the country in February. Firms located in the Midwest reported growth for the last three months, and for four of the last five months.
The ABI score is a leading economic indicator of construction activity, providing an approximately nine-to-twelve-month glimpse into the future of nonresidential construction spending activity. The score is derived from a monthly survey of architecture firms that measures the change in the number of services provided to clients.
Key ABI highlights for February include:
- Regional averages: Northeast (44.0); Midwest (50.8); South (47.7); West (47.2)
- Sector index breakdown: commercial/industrial (46.1); institutional (50.7); mixed practice (firms that do not have at least half of their billings in any one other category) (47.1); multifamily residential (44.9)
- Project inquiries index: 56.0
- Design contracts index: 51.1
The regional and sector categories are calculated as three-month moving averages and may not always average out to the national score.
Related Stories
Market Data | Nov 30, 2016
Marcum Commercial Construction Index reports industry outlook has shifted; more change expected
Overall nonresidential construction spending in September totaled $690.5 billion, down a slight 0.7 percent from a year earlier.
Industry Research | Nov 30, 2016
Multifamily millennials: Here is what millennial renters want in 2017
It’s all about technology and convenience when it comes to the things millennial renters value most in a multifamily facility.
Market Data | Nov 29, 2016
It’s not just traditional infrastructure that requires investment
A national survey finds strong support for essential community buildings.
Industry Research | Nov 28, 2016
Building America: The Merit Shop Scorecard
ABC releases state rankings on policies affecting construction industry.
Multifamily Housing | Nov 28, 2016
Axiometrics predicts apartment deliveries will peak by mid 2017
New York is projected to lead the nation next year, thanks to construction delays in 2016
Market Data | Nov 22, 2016
Construction activity will slow next year: JLL
Risk, labor, and technology are impacting what gets built.
Market Data | Nov 17, 2016
Architecture Billings Index rebounds after two down months
Decline in new design contracts suggests volatility in design activity to persist.
Market Data | Nov 11, 2016
Brand marketing: Why the B2B world needs to embrace consumers
The relevance of brand recognition has always been debatable in the B2B universe. With notable exceptions like BASF, few manufacturers or industry groups see value in generating top-of-mind awareness for their products and services with consumers.
Industry Research | Nov 8, 2016
Austin, Texas wins ‘Top City’ in the Emerging Trends in Real Estate outlook
Austin was followed on the list by Dallas/Fort Worth, Texas and Portland, Ore.
Market Data | Nov 2, 2016
Nonresidential construction spending down in September, but August data upwardly revised
The government revised the August nonresidential construction spending estimate from $686.6 billion to $696.6 billion.


