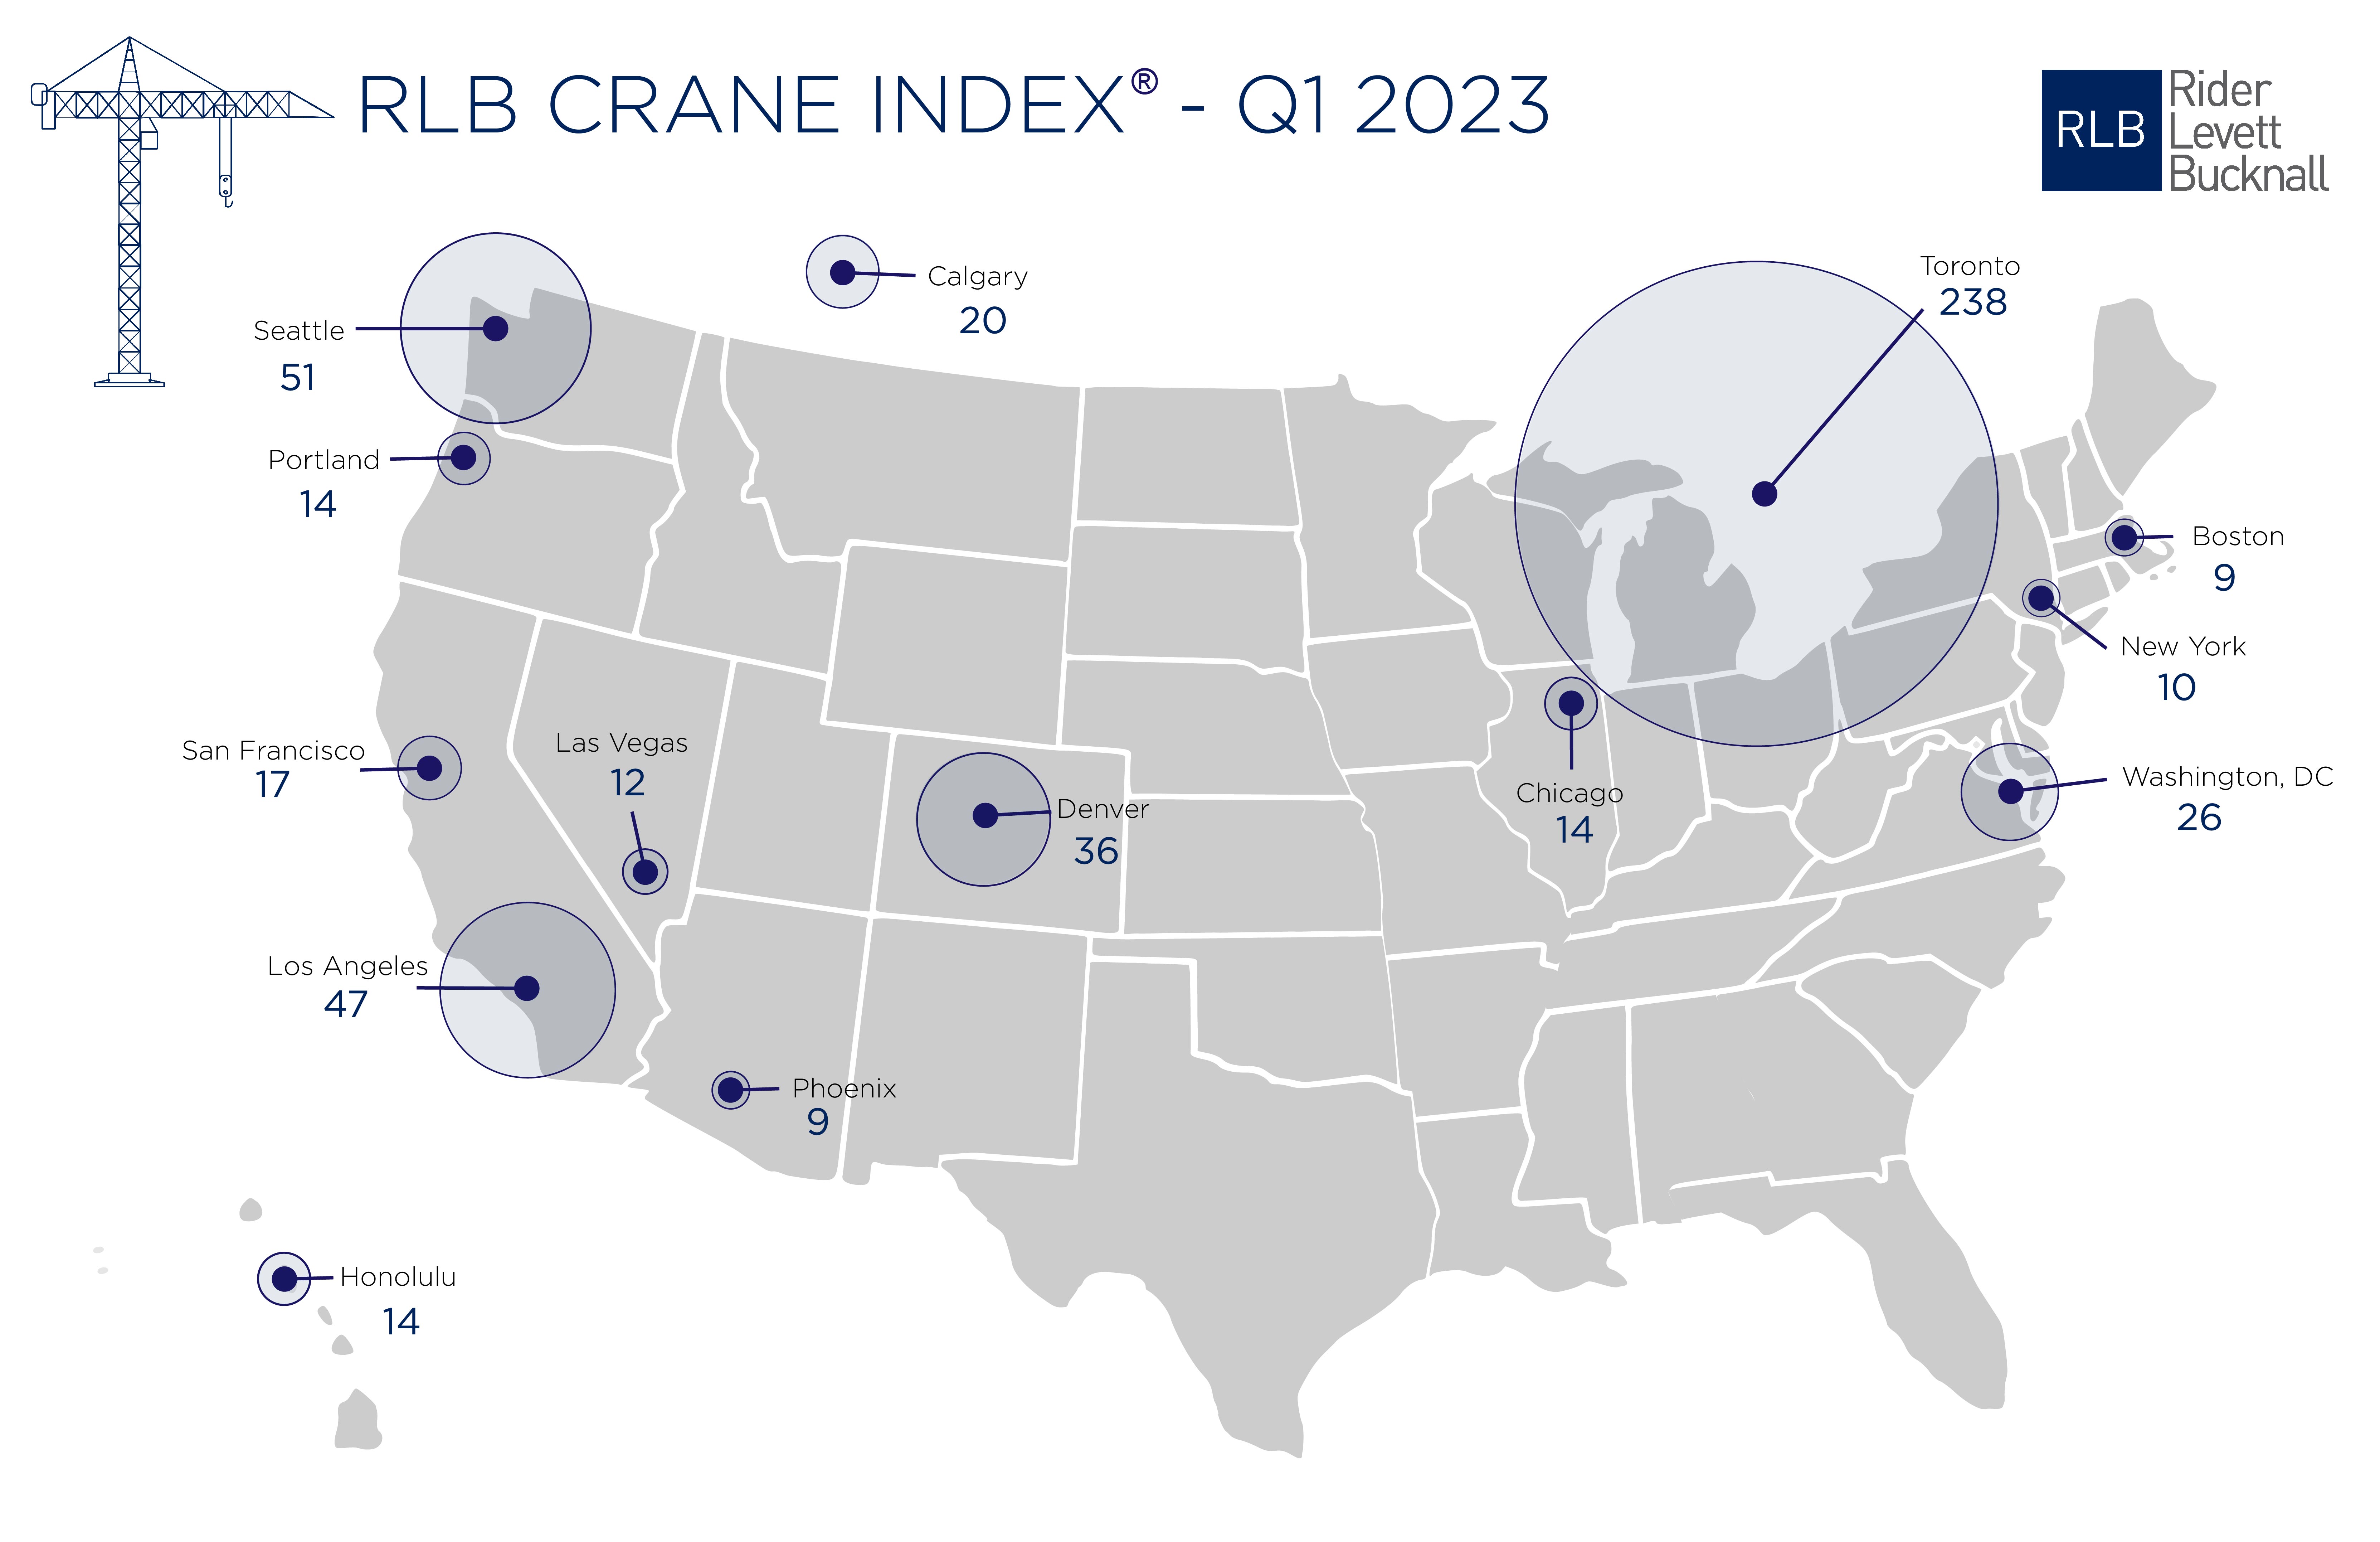
Toronto, Seattle, Los Angeles, and Denver top the list of U.S/Canadian cities with the greatest number of fixed construction cranes on construction sites, according to Rider Levett Bucknall's RLB Crane Index for North America for Q1 2023.
Toronto had a whopping 238 cranes in place in the first quarter. Seattle had 51 cranes to lead all U.S. cities, followed by Los Angeles (47), Denver (36), and Washington, D.C. (26).
The RLB survey reports a nominal increase of 7.04% (34 cranes) from the Q3 2022 edition of the RLB Crane Index. Of the 14 cities surveyed, eight experienced
an increase in cranes, two decreased, and four held steady.
The three top sectors across all cities are residential (51%), mixed use (22%), and commercial (12%).
"Despite continued workforce challenges and economic uncertainties are still concerns for the coming year, we are continuing to see new projects break ground within our 14-key markets. This indicates that investments are continuing to be made into our cities," said the report's authors.
"Notwithstanding concerns for the housing market, residential and mixed-use projects make up 73% of the overall count. We anticipate the number of cranes to remain high into 2023. Despite uncertain market conditions, construction projects will continue to break ground, albeit at a cost," the added.
About the RLB Crane Index
Rider Levett Bucknall’s Crane Index for North America is published biannually. It tracks the number of operating tower cranes in 14 major cities across the U.S. and Canada. The index was the first of its kind, and unlike other industry barometers that track cost and other financial data, the Crane Index tracks the number of fixed cranes on construction sites and gives a simplified measure of the current state of the construction industry’s workload in each location.
Related Stories
Market Data | Jan 23, 2020
Construction contractor confidence surges into 2020, says ABC
Confidence among U.S. construction industry leaders increased in November 2019 with respect to sales, profit margins, and staffing, according to the Associated Builders and Contractors Construction Confidence Index.
Market Data | Jan 22, 2020
Architecture Billings Index ends year on positive note
AIA’s Architecture Billings Index (ABI) score of 52.5 for December reflects an increase in design services provided by U.S. architecture firms.
AEC Tech | Jan 16, 2020
EC firms with a clear ‘digital roadmap’ should excel in 2020
Deloitte, in new report, lays out a risk mitigation strategy that relies on tech.
Market Data | Jan 13, 2020
Construction employment increases by 20,000 in December and 151,000 in 2019
Survey finds optimism about 2020 along with even tighter labor supply as construction unemployment sets record December low.
Market Data | Jan 10, 2020
North America’s office market should enjoy continued expansion in 2020
Brokers and analysts at two major CRE firms observe that tenants are taking longer to make lease decisions.
Market Data | Dec 17, 2019
Architecture Billings Index continues to show modest growth
AIA’s Architecture Billings Index (ABI) score of 51.9 for November reflects an increase in design services provided by U.S. architecture firms.
Market Data | Dec 12, 2019
2019 sets new record for supertall building completion
Overall, the number of completed buildings of at least 200 meters in 2019 declined by 13.7%.
Market Data | Dec 4, 2019
Nonresidential construction spending falls in October
Private nonresidential spending fell 1.2% on a monthly basis and is down 4.3% from October 2018.
Market Data | Nov 25, 2019
Office construction lifts U.S. asking rental rate, but slowing absorption in Q3 raises concerns
12-month net absorption decelerates by one-third from 2018 total.
Market Data | Nov 22, 2019
Architecture Billings Index rebounds after two down months
The Architecture Billings Index (ABI) score in October is 52.0.


