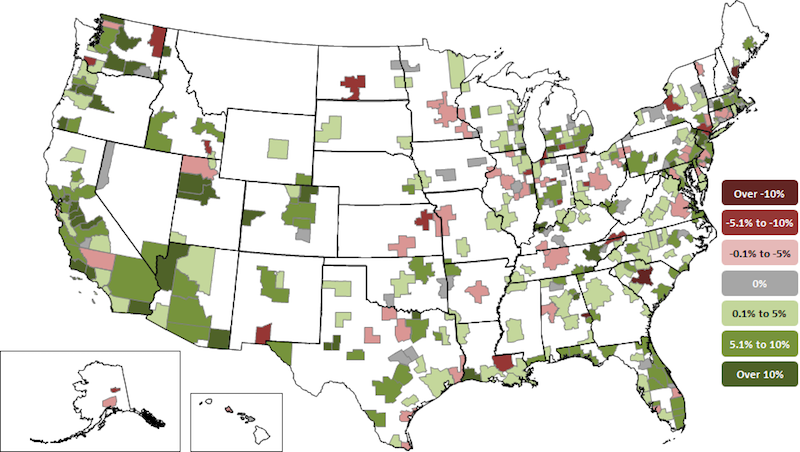
Construction employment increased in 256 out of 358 metro areas between April 2017 and April 2018, declined in 63 and was unchanged in 39, according to a new analysis of federal employment data released today by the Associated General Contractors of America. Association officials said that the data showed a continuation of strong labor demand amid shortages of qualified workers.
"Industry demand is still showing strength, as construction employment reached a new high in 54 metro areas," said Ken Simonson, the association's chief economist. "However, despite these signs, further growth in the industry may increasingly be stymied by a lack of qualified workers."
Dallas-Plano-Irving, Texas added the most construction jobs during the past year (12,400 jobs, 9%), followed by Houston-The Woodlands-Sugar Land, Texas (12,200 jobs, 6%); Phoenix-Mesa-Scottsdale, Ariz. (11,000 jobs, 10%); Midland, Texas (8,000 jobs, 31%) and Las Vegas-Henderson-Paradise, Nevada (7,700 jobs, 13%). The largest percentage gains occurred in the Midland, Texas metro area, followed by Merced, Calif. (29%, 700 jobs); New Bedford, Mass. (20%, 500 jobs); Atlantic City-Hammonton, N.J. (19%, 1,000 jobs) and Weirton-Steubenville, W.Va.-Ohio (19%, 300 jobs).
The largest job losses from April 2017 to April 2018 were in St. Louis, Mo.-Ill. (-3,100 jobs, -5%), followed by Middlesex-Monmouth-Ocean, N.J. (-2,900 jobs, -7%); Montgomery County-Bucks County-Chester County, Penn. (-2,800 jobs, -5%); Minneapolis-St. Paul-Bloomington, Minn.-Wis. (-2,400 jobs, -3%) and Columbia, S.C. (-2,200 jobs, -11%). The largest percentage decreases for the year were in Bloomington, Ill. (-16%, -500 jobs), followed by Bismarck, N.D. (-15%, -800 jobs), Auburn-Opelika, Ala. (-14%, -400 jobs); Battle Creek, Mich. (-12%, -200 jobs); and Columbia, S.C.
Association officials said that despite these widespread employment increases, many contractors report difficulty in finding qualified workers. With the national unemployment rate at a 17-year low and many metro unemployment rates at new record lows for April, finding workers is not expected to get easier in the near future. They added that education and training initiatives are the best way to increase the pool of skilled workers, creating a new generation of carpenters, electricians, and others, while giving Americans access to highly rewarding work.
"The good news is that the strong economy is driving demand for many types of construction projects," said Stephen E. Sandherr, the association's chief executive officer. "All that economic activity means that there are fewer, qualified, workers available for construction firms to hire to keep pace with demand."
Related Stories
Hotel Facilities | Jul 28, 2022
As travel returns, U.S. hotel construction pipeline growth follows
According to the recently released United States Construction Pipeline Trend Report from Lodging Econometrics (LE), the total U.S. construction pipeline stands at 5,220 projects/621,268 rooms at the close of 2022’s second quarter, up 9% Year-Over-Year (YOY) by projects and 4% YOY by rooms.
Codes and Standards | Jul 22, 2022
Hurricane-resistant construction may be greatly undervalued
New research led by an MIT graduate student at the school’s Concrete Sustainability Hub suggests that the value of buildings constructed to resist wind damage in hurricanes may be significantly underestimated.
Market Data | Jul 21, 2022
Architecture Billings Index continues to stabilize but remains healthy
Architecture firms reported increasing demand for design services in June, according to a new report today from The American Institute of Architects (AIA).
Market Data | Jul 21, 2022
Despite deteriorating economic conditions, nonresidential construction spending projected to increase through 2023
Construction spending on buildings is projected to increase just over nine percent this year and another six percent in 2023, according to a new report from the American Institute of Architects (AIA).
Building Team | Jul 18, 2022
Understanding the growing design-build market
FMI’s new analysis of the design-build market forecast for the next fives years shows that this delivery method will continue to grow, despite challenges from the COVID-19 pandemic.
Market Data | Jul 1, 2022
Nonresidential construction spending slightly dips in May, says ABC
National nonresidential construction spending was down by 0.6% in May, according to an Associated Builders and Contractors analysis of data published today by the U.S. Census Bureau.
Market Data | Jun 30, 2022
Yardi Matrix releases new national rent growth forecast
Rents in most American cities continue to rise slightly each month, but are not duplicating the rapid escalation rates exhibited in 2021.
Market Data | Jun 22, 2022
Architecture Billings Index slows but remains strong
Architecture firms reported increasing demand for design services in May, according to a new report today from The American Institute of Architects (AIA).
Building Team | Jun 17, 2022
Data analytics in design and construction: from confusion to clarity and the data-driven future
Data helps virtual design and construction (VDC) teams predict project risks and navigate change, which is especially vital in today’s fluctuating construction environment.
Market Data | Jun 15, 2022
ABC’s construction backlog rises in May; contractor confidence falters
Associated Builders and Contractors reports today that its Construction Backlog Indicator increased to nine months in May from 8.8 months in April, according to an ABC member survey conducted May 17 to June 3. The reading is up one month from May 2021.


