Top Military Sector Architecture Firms
| Rank | Company | 2012 Military Revenue ($) |
| 1 | HDR Architecture | $63,546,903 |
| 2 | Heery International | $21,224,842 |
| 3 | HKS | $13,500,000 |
| 4 | HNTB Archtecture | $12,276,306 |
| 5 | Leo A Daly | $11,114,441 |
| 6 | RTKL Associates | $10,777,000 |
| 7 | Sherlock, Smith & Adams | $9,637,000 |
| 8 | VOA Associates | $8,354,050 |
| 9 | EwingCole | $8,000,000 |
| 10 | Corgan | $7,428,547 |
| 11 | Hoefer Wysocki Architecture | $7,221,000 |
| 12 | RSP Architects | $6,831,000 |
| 13 | Reynolds, Smith and Hills | $6,540,000 |
| 14 | HOK | $6,243,000 |
| 15 | EYP | $5,800,000 |
| 16 | LS3P | $5,065,979 |
| 17 | Hammel, Green and Abrahamson | $4,092,000 |
| 18 | Flad Architects | $3,484,000 |
| 19 | Emersion Design | $3,449,838 |
| 20 | KZF Design | $3,165,696 |
| 21 | RNL | $3,102,000 |
| 22 | Morris Architects | $2,900,000 |
| 23 | ZGF Architects | $2,654,318 |
| 24 | PGAL | $2,510,000 |
| 25 | Gensler | $2,500,000 |
| 26 | Skidmore, Owings & Merrill | $2,350,000 |
| 27 | IBI Group | $2,146,453 |
| 28 | Albert Kahn Family of Companies | $2,011,177 |
| 29 | CTA Architects Engineers | $1,762,047 |
| 30 | WHR Architects | $1,476,330 |
| 31 | SmithGroupJJR | $816,000 |
| 32 | Wight & Co. | $751,000 |
| 33 | OZ Architecture | $678,554 |
| 34 | Moseley Architects | $458,816 |
| 35 | Carrier Johnson + Culture | $367,935 |
| 36 | Harvard Jolly Architecture | $213,000 |
| 37 | Gresham, Smith and Partners | $180,318 |
| 38 | Fletcher-Thompson | $150,000 |
| 39 | SMMA | Symmes Maini & McKee Associates | $115,000 |
| 40 | Cooper Carry | $104,811 |
| 41 | TEG Architects - The Estopinal Group | $30,717 |
| 42 | WDG Architecture | $6,000 |
Top Military Sector Engineering Firms
| Rank | Company | 2012 Military Revenue ($) |
| 1 | Fluor | $2,063,244,000 |
| 2 | URS Corp. | $350,209,483 |
| 3 | AECOM Technology Corp. | $256,000,000 |
| 4 | Michael Baker Jr. | $70,890,000 |
| 5 | Science Applications International Corp. | $45,989,771 |
| 6 | Burns & McDonnell | $35,650,000 |
| 7 | Clark Nexsen | $27,896,498 |
| 8 | Allen & Shariff | $27,500,000 |
| 9 | Merrick & Co. | $20,000,000 |
| 10 | STV | $16,510,000 |
| 11 | Eaton Energy Solutions | $14,462,482 |
| 12 | Parsons Brinckerhoff | $12,293,193 |
| 13 | Guernsey | $9,746,352 |
| 14 | Barge, Waggoner, Sumner and Cannon | $9,000,000 |
| 15 | Affiliated Engineers | $4,112,000 |
| 16 | BRPH | $4,000,500 |
| 17 | KCI Technologies | $4,000,000 |
| 18 | Dewberry | $3,584,673 |
| 19 | Coffman Engineers | $3,025,000 |
| 20 | H&A Architects & Engineers | $2,998,476 |
| 21 | Wiss, Janney, Elstner Associates | $2,860,000 |
| 22 | TLC Engineering for Architecture | $2,586,925 |
| 23 | RMF Engineering Design | $2,500,000 |
| 24 | Ross & Baruzzini | $2,404,599 |
| 25 | Newcomb & Boyd | $2,166,918 |
| 26 | Sparling | $2,151,181 |
| 27 | KPFF Consulting Engineers | $2,000,000 |
| 27 | Rolf Jensen & Associates | $2,000,000 |
| 29 | Smith Seckman Reid | $1,273,546 |
| 30 | Bridgers & Paxton Consulting Engineers | $1,098,183 |
| 31 | Vanderweil Engineers | $1,078,000 |
| 32 | Heapy Engineering | $1,071,676 |
| 33 | TTG | $1,050,980 |
| 34 | CCRD Partners | $1,000,000 |
| 35 | Davis, Bowen & Friedel | $816,200 |
| 36 | Henderson Engineers | $779,884 |
| 37 | M-E Engineers | $750,000 |
| 38 | Interface Engineering | $572,371 |
| 39 | GRW | $487,940 |
| 40 | Spectrum Engineers | $436,740 |
| 41 | Aon Fire Protection Engineering | $400,000 |
| 41 | Paulus, Sokolowski and Sartor | $400,000 |
| 43 | Peter Basso Associates | $300,000 |
| 44 | Syska Hennessy Group | $278,129 |
| 45 | GRAEF | $259,738 |
| 46 | Apogee Consulting Group | $251,000 |
| 47 | KJWW Engineering Consultants | $242,970 |
| 48 | Simpson Gumpertz & Heger | $200,000 |
| 49 | H.F. Lenz | $180,000 |
| 50 | SSOE Group | $146,989 |
| 51 | Glumac | $128,000 |
| 52 | CTLGroup | $100,000 |
| 52 | Dunham Associates | $100,000 |
| 52 | Rist-Frost-Shumway Engineering | $100,000 |
| 55 | Total Building Commissioning | $71,349 |
| 56 | Walter P Moore | $29,068 |
| 57 | Brinjac Engineering | $16,166 |
| 58 | Environmental Systems Design | $10,000 |
| 59 | Shive-Hattery | $3,071 |
| 60 | CJL Engineering | $3,000 |
Top Military Sector Construction Firms
| Rank | Company | 2012 Military Revenue ($) |
| 1 | Balfour Beatty | $835,493,608 |
| 2 | Hensel Phelps | $705,861,979 |
| 3 | B. L. Harbert International | $504,804,208 |
| 4 | Clark Group | $459,441,089 |
| 5 | Lend Lease | $448,232,000 |
| 6 | ECC | $404,881,855 |
| 7 | JE Dunn Construction | $383,882,914 |
| 8 | Gilbane | $343,600,000 |
| 9 | Walsh Group, The | $312,117,849 |
| 10 | Manhattan Construction | $200,119,000 |
| 11 | Weitz Co., The | $190,000,000 |
| 12 | McCarthy Holdings | $182,000,000 |
| 13 | Whiting-Turner Contracting Co., The | $173,204,860 |
| 14 | Turner Corporation, The | $163,707,000 |
| 15 | Hunt Companies | $159,295,120 |
| 16 | Mortenson Construction | $141,767,000 |
| 17 | Swinerton Builders | $128,767,700 |
| 18 | Walbridge | $113,929,436 |
| 19 | Sundt Construction | $88,800,392 |
| 20 | CORE Construction Group | $82,025,741 |
| 21 | W. M. Jordan Co. | $72,506,220 |
| 22 | Yates Cos., The | $69,400,000 |
| 23 | Jones Lang LaSalle | $60,287,223 |
| 24 | Absher Construction | $55,810,000 |
| 25 | Haskell | $52,656,368 |
| 26 | Consigli Construction | $49,230,541 |
| 27 | Messer Construction | $33,725,402 |
| 28 | Skanska USA | $33,600,000 |
| 29 | Harkins Builders | $30,500,000 |
| 30 | Brasfield & Gorrie | $29,147,688 |
| 31 | Hunt Construction Group | $29,000,000 |
| 32 | Suffolk Construction | $28,999,924 |
| 33 | Barton Malow | $25,600,015 |
| 34 | PCL Construction Enterprises | $19,907,096 |
| 35 | Coakley & Williams Construction | $16,555,554 |
| 36 | New South Construction | $13,300,000 |
| 37 | S. M. Wilson & Co. | $9,637,564 |
| 38 | Hoffman Construction | $7,820,967 |
| 39 | C.W. Driver | $6,896,321 |
| 40 | Choate Construction | $4,921,619 |
| 41 | Robins & Morton | $4,200,000 |
| 42 | Bomel Construction | $2,400,000 |
| 43 | Flintco | $1,400,000 |
| 44 | KBE Building Corporation | $1,229,621 |
| 45 | Doster Construction | $1,124,889 |
| 46 | Hoar Construction | $1,101,000 |
| 47 | Graycor | $571,323 |
| 48 | Power Construction | $200,000 |
| 49 | Tutor Perini Corporation | $188,000 |
| 50 | Alberici Constructors | $100,186 |
| 51 | DPR Construction | $86,891 |
| 52 | E.W. Howell | $85,000 |
Read the full 2013 Giants 300 Report
Related Stories
Giants 400 | Aug 28, 2020
2020 Giants 400 Report: Ranking the nation's largest architecture, engineering, and construction firms
The 2020 Giants 400 Report features more than 130 rankings across 25 building sectors and specialty categories.
Architects | Aug 27, 2020
Strategically planning your firm past the COVID-19 pandemic
As AEC firm leaders consider worst-case scenarios and explore possible solutions to surmount them, they learn to become nimble, quick, and ready to pivot as circumstances demand.
Digital Twin | Aug 27, 2020
The Weekly show: Digital twin technology and social equity in the AEC market
The August 27 episode of BD+C's "The Weekly" is available for viewing on demand.
Coronavirus | Aug 25, 2020
Video: 5 building sectors to watch amid COVID-19
RCLCO's Brad Hunter reveals the winners and non-winners of the U.S. real estate market during the coronavirus pandemic.
University Buildings | Jul 24, 2020
A hybrid learning approach could redefine higher education
Universities reassess current assets to determine growth strategies.
Coronavirus | Jun 12, 2020
BD+C launches 'The Weekly,' a streaming program for the design and construction industry
The first episode, now available on demand, features experts from Robins & Morton, Gensler, and FMI on the current state of the AEC market.
Coronavirus | May 26, 2020
9 tips for mastering virtual public meetings during the COVID-19 pandemic
Mike Aziz, AIA, presents 9 tips for mastering virtual public meetings during the COVID-19 pandemic.
Coronavirus | May 18, 2020
Infection control in office buildings: Preparing for re-occupancy amid the coronavirus
Making workplaces safer will require behavioral resolve nudged by design.
Data Centers | May 8, 2020
Data centers as a service: The next big opportunity for design teams
As data centers compete to process more data with lower latency, the AEC industry is ideally positioned to develop design standards that ensure long-term flexibility.
Coronavirus | Apr 30, 2020
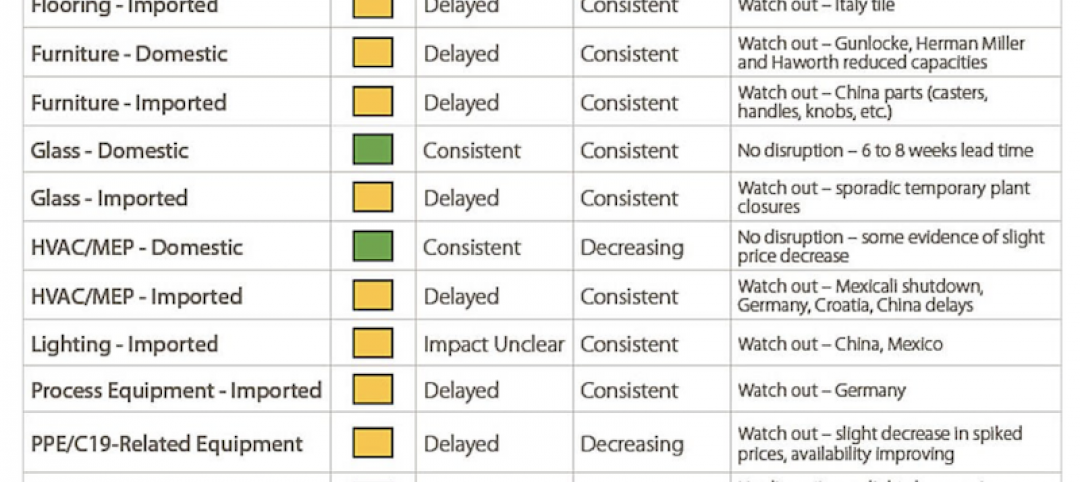
Gilbane shares supply-chain status of products affected by coronavirus
Imported products seem more susceptible to delays


