Yardi® Matrix analyzed multifamily transaction activity for its final special report of 2020, and found that property sales are down sharply – though impact varies regionally - as a result of the pandemic.
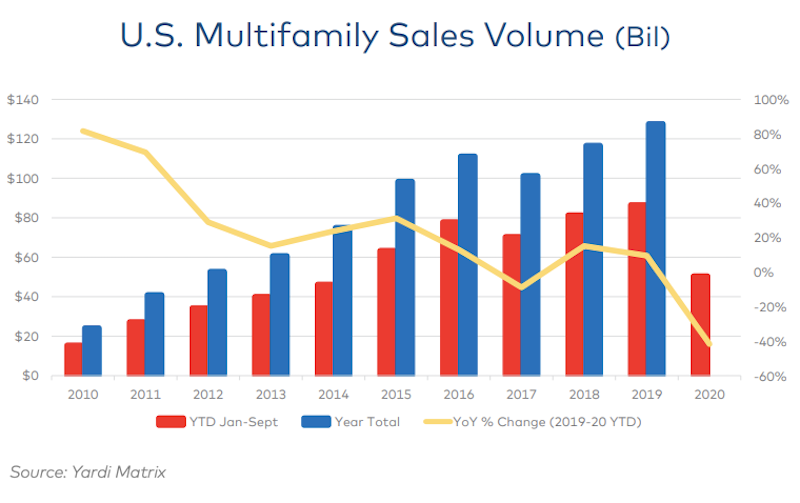
Through three quarters in 2020, $50.6 billion of multifamily property sales were completed in the U.S., down 41.7% from $86.5 billion through the same period a year ago, according to the report. There’s little hope full-year volume will get close to 2019’s record high of $127.8 billion. Gateway and coastal metros have generally seen a larger decline in deal flow than secondary and tertiary markets in the Sun Belt and Southwest.
“Much of the change could be described as a ‘filtering’ effect: investors moving from urban cores to inner-ring suburbs, from primary to secondary metros and from secondary to tertiary metros. This phenomenon results from several factors, including owners putting fewer properties on the market, disagreement between buyers and sellers about prices, the composition of buyers, and the competition for assets,” states the report.
Like many industries, multifamily sales saw a stronger performance in Q3 than during earlier in the year. Capital availability is relatively strong due to lack of better alternatives, optimism about future demand for housing, and the stability afforded by the government-sponsored enterprises Fannie Mae and Freddie Mac.
Gain all the insight in this special multifamily transaction report from industry data leader Yardi Matrix.
Yardi Matrix offers the industry’s most comprehensive market intelligence tool for investment professionals, equity investors, lenders and property managers who underwrite and manage investments in commercial real estate. Yardi Matrix covers multifamily, industrial, office and self storage property types. Email matrix@yardi.com, call 480-663-1149 or visit yardimatrix.com to learn more.
Related Stories
Market Data | Oct 2, 2019
Spending on nonresidential construction takes a step back in August
Office, healthcare, and public safety are among the fastest-growing sectors, according to the U.S. Census Bureau's latest report.
Market Data | Sep 27, 2019
The global hotel construction pipeline ascends to new record highs
With the exception of Latin America, all regions of the globe either continued to set record high pipeline counts or have already settled into topping-out formations amidst concerns of a worldwide economic slowdown.
Market Data | Sep 25, 2019
Senate introduces The School Safety Clearinghouse Act
Legislation would create a federally funded and housed informational resource on safer school designs.
Market Data | Sep 18, 2019
Substantial decline in Architecture Billings
August report suggests greatest weakness in design activity in several years.
Market Data | Sep 17, 2019
ABC’s Construction Backlog Indicator inches lower in July
Backlog in the heavy industrial category increased by 2.3 months and now stands at its highest level in the history of the CBI series.
Market Data | Sep 13, 2019
Spending on megaprojects, already on the rise, could spike hard in the coming years
A new FMI report anticipates that megaprojects will account for one-fifth of annual construction spending within the next decade.
Architects | Sep 11, 2019
Buoyed by construction activity, architect compensation continues to see healthy gains
The latest AIA report breaks down its survey data by 44 positions and 28 metros.
Market Data | Sep 11, 2019
New 2030 Commitment report findings emphasize need for climate action
Profession must double down on efforts to meet 2030 targets.
Market Data | Sep 10, 2019
Apartment buildings and their residents contribute $3.4 trillion to the national economy
New data show how different aspects of the apartment industry positively impact national, state and local economies.
Market Data | Sep 3, 2019
Nonresidential construction spending slips in July 2019, but still surpasses $776 billion
Construction spending declined 0.3% in July, totaling $776 billion on a seasonally adjusted annualized basis.


