The latest national self storage report from Yardi® Matrix shows that heavy new-supply deliveries and slowing economic fundamentals are dampening street rate growth in many U.S. metros.
The report, a compilation of data from more than 2,200 properties in the new-supply pipeline, shows that development activity has been pronounced in fast-growing cities as well as historically underdeveloped urban markets where supply is catching up to demand. Street rates for 10x10 units decreased 3% year-over-year nationwide in June 2018; by contrast, they rose 1% and 2% year-over-year in April and May, respectively.
Metros with the most units under construction and planned as a percent of existing inventory in mid-July were Nashville, Tenn.; Portland, Ore.; Boston; Denver; and San Jose, Calif.
The full national self storage report for July 2018 is available for download.
Related Stories
Market Data | Apr 18, 2019
ABC report: 'Confidence seems to be making a comeback in America'
The Construction Confidence Index remained strong in February, according to the Associated Builders and Contractors.
Market Data | Apr 16, 2019
ABC’s Construction Backlog Indicator rebounds in February
ABC's Construction Backlog Indicator expanded to 8.8 months in February 2019.
Market Data | Apr 8, 2019
Engineering, construction spending to rise 3% in 2019: FMI outlook
Top-performing segments forecast in 2019 include transportation, public safety, and education.
Market Data | Apr 1, 2019
Nonresidential spending expands again in February
Private nonresidential spending fell 0.5% for the month and is only up 0.1% on a year-over-year basis.
Market Data | Mar 22, 2019
Construction contractors regain confidence in January 2019
Expectations for sales during the coming six-month period remained especially upbeat in January.
Market Data | Mar 21, 2019
Billings moderate in February following robust New Year
AIA’s Architecture Billings Index (ABI) score for February was 50.3, down from 55.3 in January.
Market Data | Mar 19, 2019
ABC’s Construction Backlog Indicator declines sharply in January 2019
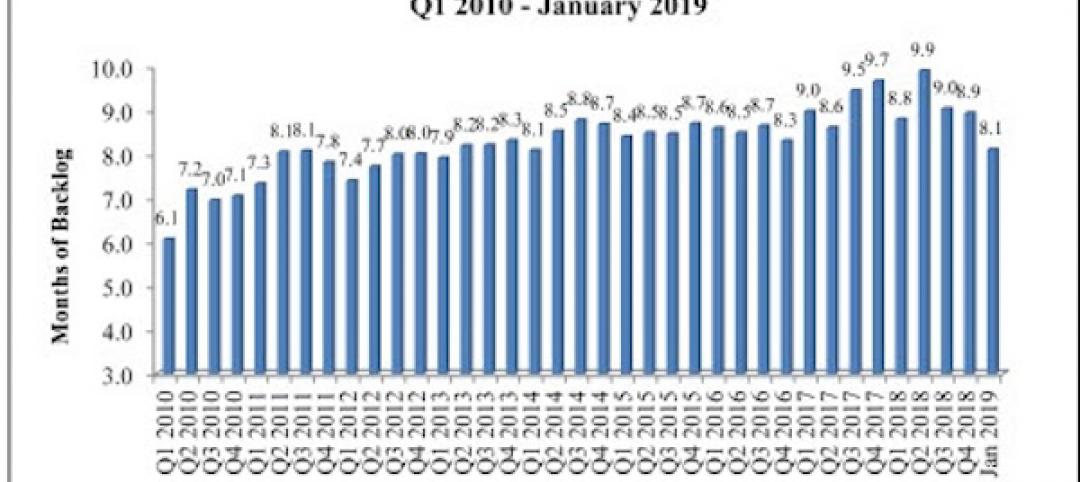
The Construction Backlog Indicator contracted to 8.1 months during January 2019.
Market Data | Mar 15, 2019
2019 starts off with expansion in nonresidential spending
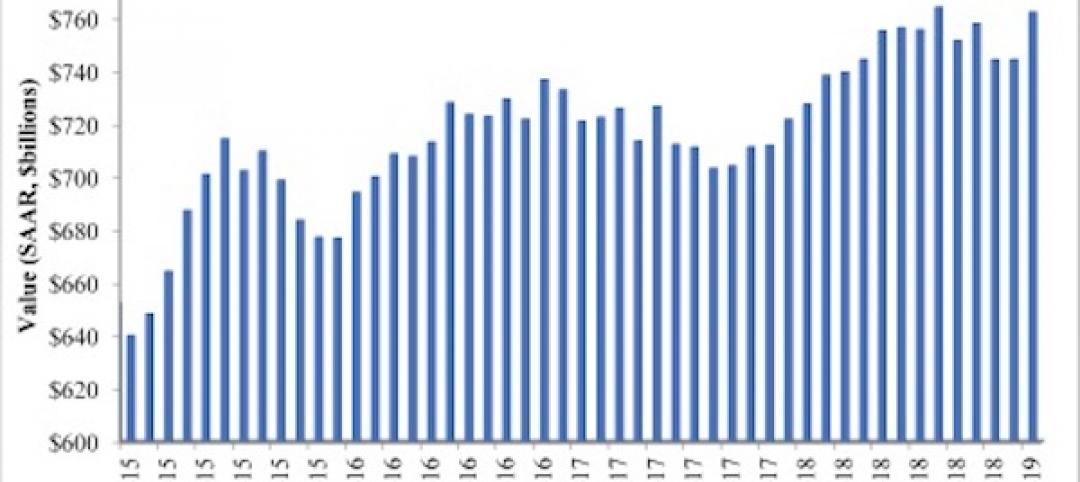
At a seasonally adjusted annualized rate, nonresidential spending totaled $762.5 billion for the month.
Market Data | Mar 14, 2019
Construction input prices rise for first time since October
Of the 11 construction subcategories, seven experienced price declines for the month.
Market Data | Mar 6, 2019
Global hotel construction pipeline hits record high at 2018 year-end
There are a record-high 6,352 hotel projects and 1.17 million rooms currently under construction worldwide.


