

From July through October of 2020, national construction costs rose, on average, by 0.25%, based on 14 markets in North America tracked by the construction consulting firm Rider Levett Bucknall (RLB), which has just released its North America Construction Cost report for the fourth quarter of 2020.
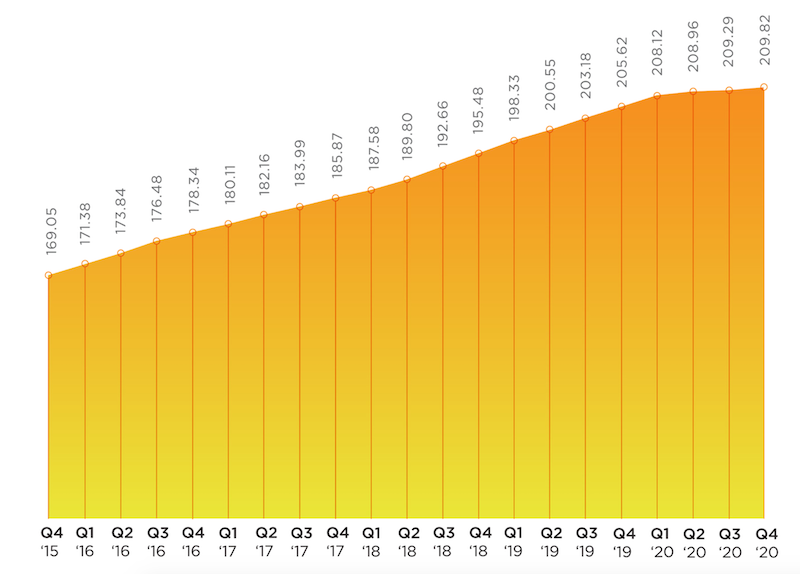
Over the first 10 months of last year, construction spending rose by 3.7% to $1.439 trillion, according to Census Bureau estimates. Construction costs were up by 2.03%. RLB’s National Construction Cost Index stood at 209.82 for the fourth quarter of last year, compared to 205.62 for the same period a year earlier. After rising consistently since the fourth quarter of 2015, RLB’s Index tapered off last year.
The full report can be downloaded from here.
Given the impact of construction activity from the coronavirus pandemic, “the economic damage incurred over the past nine months will take time to heal,” writes Julian Anderson, FRICS, President-North America for RLB.
Anderson expresses concern about lingering unemployment that is “casting a darker shadow over the economy.” He speaks optimistically about President-Elect Joe Biden’s expansive infrastructure plan, whose passage became more likely now that Democrats will control the executive and legislative branches following the election of two Democratic senators in Georgia earlier this month.
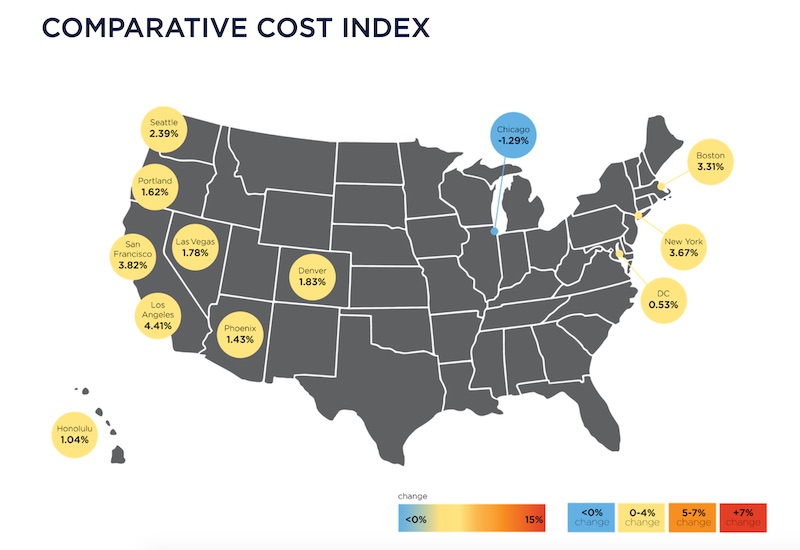
For the most part, inflation is under control in the construction sectors of U.S. metros.
Anderson predicts that Biden’s plan will receive bipartisan support “if it is tied to creating jobs that have been lost due to the pandemic.” The New York Times, quoting Bureau of Labor Statistics estimates, reported on January 9 that 9.4 million jobs were lost in the U.S. in 2020, the worst year since World War II.
Construction unemployment, which spiked in the second quarter when the coronavirus delayed or postponed projects, has recovered of late. The industry gained 51,00 jobs in December, even though the total for the year was down 142,000, or 1.9%. However, a survey that included 1,329 responses, conducted by Associated General Contractors of America (AGC) in every state from Nov. 11 through Dec. 11, found that contractors are generally pessimistic about the outlook for nonresidential and multifamily construction in 2021.
SAN FRANCISCO STILL COSTLIEST MARKET
RLB’s report breaks down its Cost Index by cities and building types. For example, San Francisco, New York, and Boston registered the highest indices for prime office construction. Chicago, Honolulu, and San Francisco had the highest cost indices for five-star hotels. Los Angeles is the most expensive market in which to build hospitals, in part because of California’s seismic mitigation requirements.
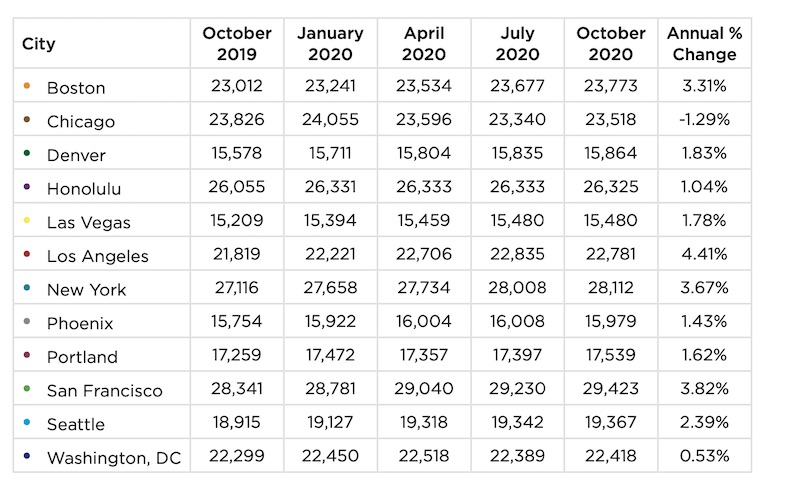
This chart shows the relative costs of materials and labor as bid in markets around the U.S., and the average percentage change from October 2019 to October 2020.
San Francisco and Los Angeles had the highest indices for the Industrial sector, Sn Francisco and Seattle for multifamily costs, and Honolulu and New York for costs attendant to building high schools.
All told, Chicago, Boston, New York, Portland, and San Francisco all experienced cost increases that were higher than the national average in the latest quarter, even though Chicago’s Cost Index was lower, by 1.29%, for the year. Conversely, Los Angeles experienced the highest October 2019-October 2020 increase in its Cost Index, 4.41%, despite a slight decline in the latest quarter. And for the year, San Francisco had the highest “as bid” index measuring a representative sampling of materials and labor among the markets tracked.
Denver, Seattle, and Washington D.C. saw quarterly increases that were below the national average for construction costs.
Related Stories

Market Data | Jan 23, 2020
Construction contractor confidence surges into 2020, says ABC
Confidence among U.S. construction industry leaders increased in November 2019 with respect to sales, profit margins, and staffing, according to the Associated Builders and Contractors Construction Confidence Index.
Market Data | Jan 22, 2020
Architecture Billings Index ends year on positive note
AIA’s Architecture Billings Index (ABI) score of 52.5 for December reflects an increase in design services provided by U.S. architecture firms.
AEC Tech | Jan 16, 2020
EC firms with a clear ‘digital roadmap’ should excel in 2020
Deloitte, in new report, lays out a risk mitigation strategy that relies on tech.
Market Data | Jan 13, 2020
Construction employment increases by 20,000 in December and 151,000 in 2019
Survey finds optimism about 2020 along with even tighter labor supply as construction unemployment sets record December low.

Market Data | Jan 10, 2020
North America’s office market should enjoy continued expansion in 2020
Brokers and analysts at two major CRE firms observe that tenants are taking longer to make lease decisions.

Market Data | Dec 17, 2019
Architecture Billings Index continues to show modest growth
AIA’s Architecture Billings Index (ABI) score of 51.9 for November reflects an increase in design services provided by U.S. architecture firms.

Market Data | Dec 12, 2019
2019 sets new record for supertall building completion
Overall, the number of completed buildings of at least 200 meters in 2019 declined by 13.7%.

Market Data | Dec 4, 2019
Nonresidential construction spending falls in October
Private nonresidential spending fell 1.2% on a monthly basis and is down 4.3% from October 2018.

Market Data | Nov 25, 2019
Office construction lifts U.S. asking rental rate, but slowing absorption in Q3 raises concerns
12-month net absorption decelerates by one-third from 2018 total.
Market Data | Nov 22, 2019
Architecture Billings Index rebounds after two down months
The Architecture Billings Index (ABI) score in October is 52.0.


