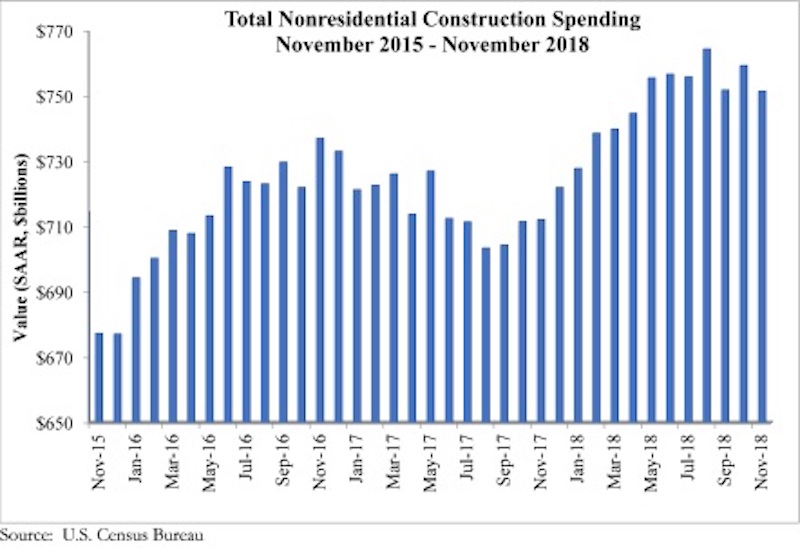
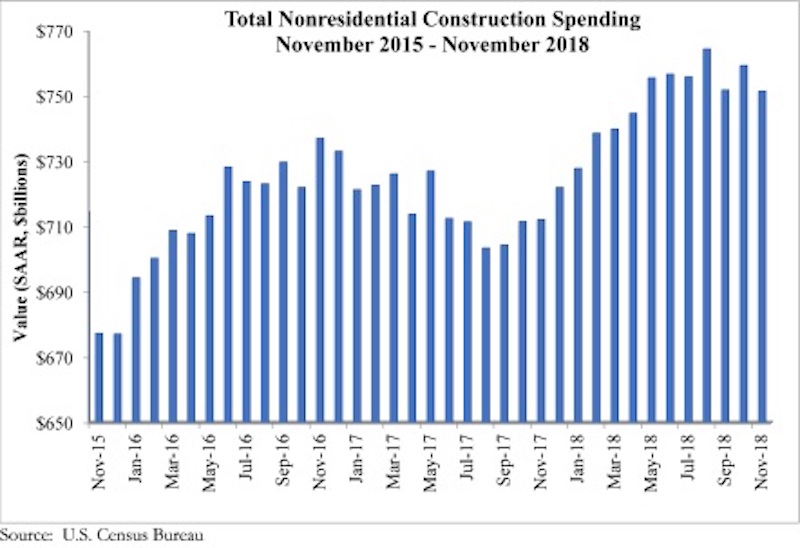
National nonresidential construction spending declined 1% in November, according to an Associated Builders and Contractors analysis of U.S. Census Bureau data recently released. The release of November data, originally scheduled for Jan. 3, was delayed by the partial government shutdown.
Total nonresidential spending stood at $751.5 billion on a seasonally adjusted annualized rate, which represents a 5.5% increase over November 2017. However, 12 of the 16 nonresidential subsectors experienced monthly declines.
“One of the most interesting and surprising aspect of today’s release was evident of a dip in infrastructure spending, at least in certain categories,” said ABC Chief Economist Anirban Basu. “Spending on infrastructure was one of the key sources of nonresidential construction spending growth for much of last year, but declines in monthly construction spending were observed in the public safety, water supply and educational categories. This pattern is likely to prove temporary, given the healthier conditions of state and local government finances in much of the nation.

“The dip in November spending should not be viewed as a leading indicator of coming decline,” said Basu. “The government’s employment numbers indicate that contractors have continued to take on more staff, presumably because there is a growing amount of work to be done. While weather-related impacts are more severe at this time of year, rendering employment and other data more difficult to interpret, the U.S. economy still growing, and with more people working, that should ultimately translate into expanding nonresidential construction spending.
“However, there was a meaningful decline in spending in the commercial category,” said Basu. “Many brick and mortar retailers continue to struggle with the imposing presence of Amazon and other large-scale online sellers. This is translating into more store closings and probably fewer new stores being built. Still, the consumer segment of the economy remains strong, suggesting that other elements of the commercial segment, including fulfillment center and warehouse construction, will perform decently in 2019.”
Related Stories
Market Data | Jul 20, 2019
Construction costs continued to rise in second quarter
Labor availability is a big factor in that inflation, according to Rider Levett Bucknall report.
Market Data | Jul 18, 2019
Construction contractors remain confident as summer begins
Contractors were slightly less upbeat regarding profit margins and staffing levels compared to April.
Market Data | Jul 17, 2019
Design services demand stalled in June
Project inquiry gains hit a 10-year low.
Market Data | Jul 16, 2019
ABC’s Construction Backlog Indicator increases modestly in May
The Construction Backlog Indicator expanded to 8.9 months in May 2019.
K-12 Schools | Jul 15, 2019
Summer assignments: 2019 K-12 school construction costs
Using RSMeans data from Gordian, here are the most recent costs per square foot for K-12 school buildings in 10 cities across the U.S.
Market Data | Jul 12, 2019
Construction input prices plummet in June
This is the first time in nearly three years that input prices have fallen on a year-over-year basis.
Market Data | Jul 1, 2019
Nonresidential construction spending slips modestly in May
Among the 16 nonresidential construction spending categories tracked by the Census Bureau, five experienced increases in monthly spending.
Market Data | Jul 1, 2019
Almost 60% of the U.S. construction project pipeline value is concentrated in 10 major states
With a total of 1,302 projects worth $524.6 billion, California has both the largest number and value of projects in the U.S. construction project pipeline.
Market Data | Jun 21, 2019
Architecture billings remain flat
AIA’s Architecture Billings Index (ABI) score for May showed a small increase in design services at 50.2.
Market Data | Jun 19, 2019
Number of U.S. architects continues to rise
New data from NCARB reveals that the number of architects continues to increase.


