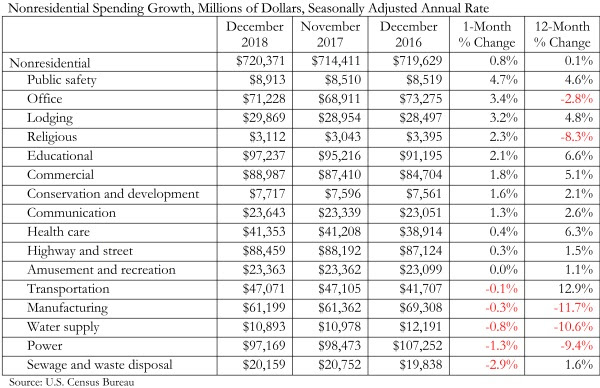
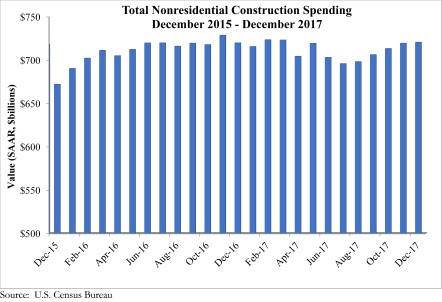
Nonresidential construction spending expanded 0.8% in December, totaling $720.4 billion on a seasonally adjusted basis, according to Associated Builders and Contractors’ (ABC) analysis of data released today by the U.S. Census Bureau. This represents the fifth consecutive month during which the pace of nonresidential spending has increased.
Nonresidential spending expanded 0.1% on a year-over-year basis and sits at its highest level since March. Private nonresidential construction spending increased 1.1% for the month, but is down 2.5% year over year, while public nonresidential spending increased 0.4% for the month and 4.4% for the year. Spending in the power and manufacturing categories, which are two of the largest nonresidential subsectors, contracted by a combined 10.3%, or $18.2 billion, since December 2016.
“While data releases are important for many reasons, including helping us to understand what happened in the past, their principal value lies in clarifying our shared understanding of the probable future,” said ABC Chief Economist Anirban Basu. “Today’s data release, which essentially confirms the existence of the ongoing construction expansion cycle, is less useful than usual. The obvious reason is that the December data reflect a pre-existing pattern of construction spending. The future is likely to represent a departure from prior trends, in large measure because of the recently passed tax reform bill.
“Even before the United States enacted tax reform, global and domestic financial systems were flush with liquidity and capital,” said Basu. “The tax cut will further bolster liquidity and confidence, which will ultimately translate into more construction starts and spending. If long-awaited progress is made on infrastructure spending, the construction recovery will likely transition from solid to spectacular. Note that the transportation category has already expanded 12.9% on a year-over-year basis. During much of the past three years, spending growth generally has been concentrated in a number of key private construction segments, while public construction has tended to lag.
“Of course, industry insiders are scratching their collective heads regarding how to amass enough human capital to actually deliver construction services on time and on budget,” said Basu. “Frankly, that’s a mystery. The implication is that any infrastructure package must be accompanied by action that helps expand apprenticeship programs, steps up investment in two-year colleges, encourages high schools to offer career and technical education, and encourages more people to leap into the U.S. labor force.”
Related Stories
Market Data | Nov 22, 2021
Only 16 states and D.C. added construction jobs since the pandemic began
Texas, Wyoming have worst job losses since February 2020, while Utah, South Dakota add the most.
Market Data | Nov 10, 2021
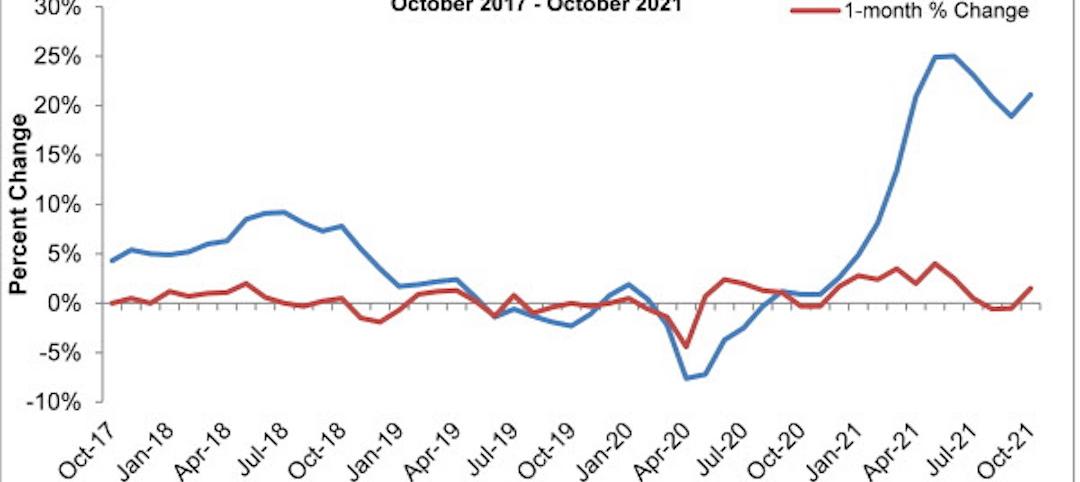
Construction input prices see largest monthly increase since June
Construction input prices are 21.1% higher than in October 2020.
Market Data | Nov 9, 2021
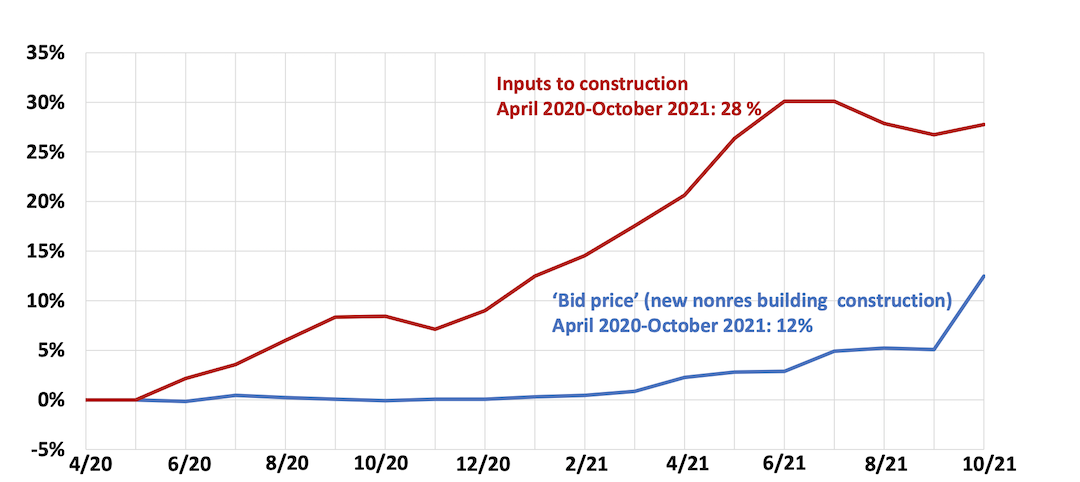
Continued increases in construction materials prices starting to drive up price of construction projects
Supply chain and labor woes continue.
Market Data | Nov 5, 2021
Construction firms add 44,000 jobs in October
Gain occurs even as firms struggle with supply chain challenges.
Market Data | Nov 3, 2021
One-fifth of metro areas lost construction jobs between September 2020 and 2021
Beaumont-Port Arthur, Texas and Sacramento--Roseville--Arden-Arcade Calif. top lists of gainers.
Market Data | Nov 2, 2021
Construction spending slumps in September
A drop in residential work projects adds to ongoing downturn in private and public nonresidential.
Hotel Facilities | Oct 28, 2021
Marriott leads with the largest U.S. hotel construction pipeline at Q3 2021 close
In the third quarter alone, Marriott opened 60 new hotels/7,882 rooms accounting for 30% of all new hotel rooms that opened in the U.S.
Hotel Facilities | Oct 28, 2021
At the end of Q3 2021, Dallas tops the U.S. hotel construction pipeline
The top 25 U.S. markets account for 33% of all pipeline projects and 37% of all rooms in the U.S. hotel construction pipeline.
Market Data | Oct 27, 2021
Only 14 states and D.C. added construction jobs since the pandemic began
Supply problems, lack of infrastructure bill undermine recovery.
Market Data | Oct 26, 2021
U.S. construction pipeline experiences highs and lows in the third quarter
Renovation and conversion pipeline activity remains steady at the end of Q3 ‘21, with conversion projects hitting a cyclical peak, and ending the quarter at 752 projects/79,024 rooms.


