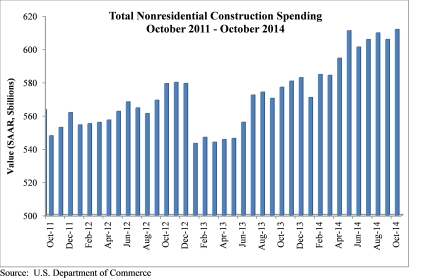
Nonresidential construction spending bounced back in October, expanding 1 percent on a monthly basis and 4.3 percent year over year, according to a Dec. 2 release from the U.S. Census Bureau. Spending for the month totaled $611.8 billion on a seasonally adjusted, annualized basis. Additionally, the government revised the September spending figure up to $605.8 billion from $596.1 billion.
"This month's increase in nonresidential construction spending is far more consistent with the anecdotal information floating around the industry, which generally indicates that firms are becoming busier and that backlog is expanding," said Associated Builders and Contractors (ABC) Chief Economist Anirban Basu. "Although last month's numbers for nonresidential construction spending and employment were disappointing and could have implied the nation's nonresidential construction recovery is stalling, that is not the case.
"The outlook for 2015 remains upbeat," said Basu. "The economy has gained momentum over the past six to seven months and that is consistent with more aggressive construction starts and spending during the year to come. Even as the economy has gained momentum, the Federal Reserve has remained extraordinarily accommodative due in part to benign inflation readings. Low interest rates combined with solid economic momentum likely mean expansion for the nonresidential construction industry during the year ahead."
Eleven of the 16 nonresidential construction subsectors posted monthly increases in spending. Here's a recap:
• Office-related construction spending grew by 2 percent in October and is up 16.3 percent from the same time one year ago.
• Lodging construction spending is up 3.3 percent on a monthly basis and is up 15.9 percent on a year-over-year basis.
• Conservation and development-related construction spending grew 4.6 percent for the month and is up 33.1 percent on a yearly basis.
• Spending in the water supply category expanded 0.9 percent on a monthly basis, but is down 1.8 percent on a year-over-year basis.
• Amusement and recreation-related construction spending expanded 2.2 percent in October and is up 1.4 percent from the same time last year.
• Manufacturing-related spending expanded 3.4 percent on a monthly basis and is up 22.2 percent on an annual basis.
• Healthcare-related construction spending expanded 0.6 percent for the month but is down 8.4 percent from the same time last year.
• Education-related construction spending expanded 1.8 percent for the month and is up 3.6 percent on a year-over-year basis.
• Construction spending in the transportation category expanded 2.7 percent on a monthly basis and has expanded 1.6 percent on an annual basis.
• Highway and street-related construction spending expanded 1.2 percent in October and is up 0.1 percent compared to the same time last year.
• Public safety-related construction spending expanded 11.6 percent on a monthly basis but is down 1.2 percent on a year-over-year basis.
Monthly spending in five nonresidential construction subsectors declined in October. They are:
• Commercial construction spending fell 2.2 percent for the month but has grown 9.1 percent on a year-over-year basis.
• Communication construction spending declined 1.9 percent for the month and is down 9.4 percent for the year.
• Religious construction spending fell 3.7 percent for the month and is down 4.6 percent from the same time last year.
• Sewage and waste disposal-related construction spending declined 0.4 percent for the month and is down 0.2 percent on a 12-month basis.
• Power construction spending fell 1 percent for the month but is 0.7 percent higher than at the same time one year ago.
To view the previous spending report, click here.
Related Stories
| Feb 21, 2012
Three Goettsch leaders elevated to AIA College of Fellows
Honor recognizes significant contributions to architecture and society.
| Feb 21, 2012
Skanska welcomes Morrison and Viviano to Atlanta office
Morrison will serve as a vice president and Viviano will serve as senior director of business development for Georgia.
| Feb 21, 2012
PV America West conference showcases solar growth market
Solar industry gathers March 19-21, 2012 in San Jose to discuss technology, market development and policy.
| Feb 21, 2012
SMPS announces Build Business 2012 keynote speakers
National conference set for July 11–13 in San Francisco.
| Feb 20, 2012
Comment period for update to USGBC's LEED Green Building Program now open
This third draft of LEED has been refined to address technical stringency and rigor, measurement and performance tools, and an enhanced user experience.
| Feb 20, 2012
Sto Corp. announces new technical director for Canada
Edgar will have full responsibility of specifications, details, website technical content, testing and approvals, and will support the Canada sales team.
| Feb 20, 2012
GAF introduces web portal for architects and specifiers
The new portal offers a clean look with minimal clutter to make it easier to find the technical information and product data that architects need.
| Feb 20, 2012
All Steel names Breagy director of metro New York
Breagy is responsible for overseeing this region’s sales team while strategically coordinating the sales efforts of Allsteel dealers and representatives in the tri-state area.
| Feb 17, 2012
Tremco Inc. headquarters achieves LEED Gold certification
Changes were so extensive that the certification is for new construction and not for renovation; officially, the building is LEED-NC.


