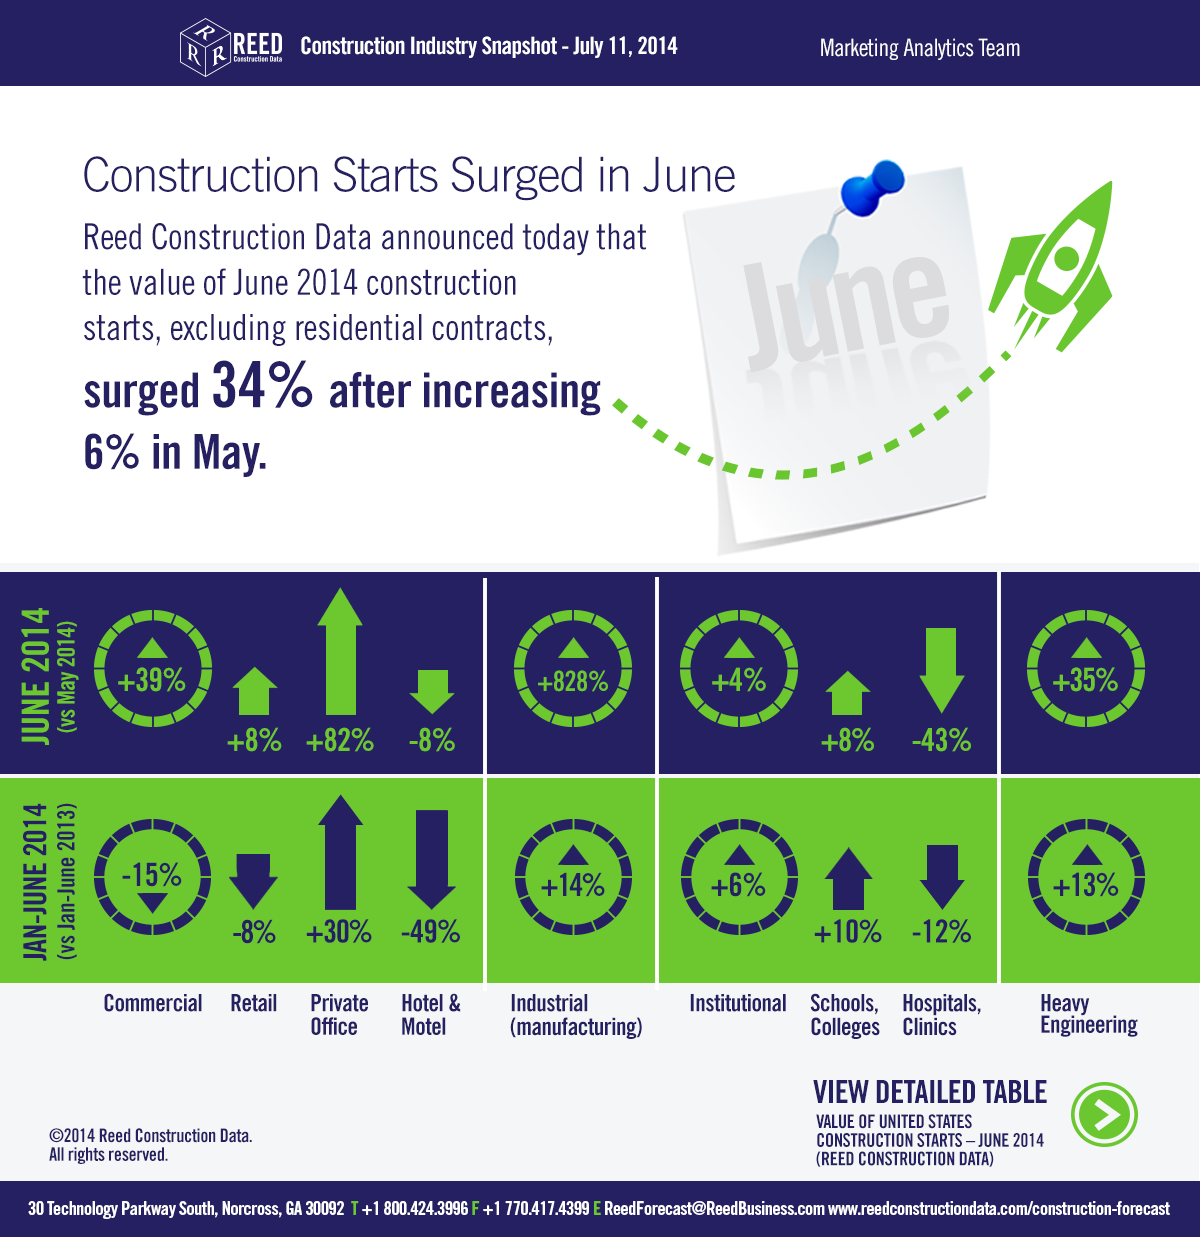
Reed Construction Data has announced that the dollar value of construction starts in June, excluding residential activity, surged 34% versus May. The figures are in "current" dollars, meaning they are not adjusted for inflation.
The individual month of June, at $32.0 billion, was one of the strongest in Reed's entire database. To find a similarly high volume, one has to look back at June 2008, just before the Great Recession really took hold.
The one-third increase was an outsized gain, even after taking into account seasonality. Reed's long-term average May-to-June increase has been 4.5%. By comparison, May's month-to-month percentage change was +6.2% and April's -4.5%.
June starts this year compared with June of last year were +14.4%. The year-to-date level of total nonresidential construction starts, at $138 billion, was +2.4% when compared with the same January to June period of 2013.
Nonresidential construction accounts for a considerably larger share than of the total than residential work. The former's proportion of total put-in-place construction in the Census Bureau's May report was 62% versus the latter's 38%.
Reed's construction starts are leading indicators for the Census Bureau's capital investment or put-in-place series.
After a shockingly harsh winter, during which GDP contracted, the U.S. economy is back on an expansionary path with stock market indices near record highs and the unemployment rate close to the nation's 20-year average of 6.0%. Firms in the private sector are feeling more pressure to build new facilities.
The month-to-month leaders among major nonresidential construction categories were commercial +39%, and heavy engineering +34.7%. Institutional work was also up +3.6%, but to a much lesser degree. Industrial starts recorded a large percentage gain, but it came on top of a smaller dollar volume than the other three.
Commercial starts this June were even more impressive, +48.5%, when compared with June of last year. Engineering starts this June versus the same month last year were +13.7%. Institutional starts were -8.1%.
Year to date, heavy engineering (+13%) is out front, followed by institutional (+5.9%). Commercial starts (-14.5%) are still down from last year. Industrial work is 13.5%.
In commercial construction's two largest sub-categories, retail starts were +8.3% month to month, but -8.1% year to date, while private office building starts were +81.6% month to month and +29.6 year to date.
In the institutional category of work, school and college starts were +7.5% month to month and +9.7% year over year. Hospital/clinic starts moved in the opposite direction, -43.2% month to month and -12.3% year to date.
With the exception of dam/marine work, all the sub-categories of heavy engineering construction were ahead both month to month and year to date, with water and sewage work especially strong versus May, +40.2.
Institutional and heavy engineering work have especially close ties to government finances. Washington's deficit is diminishing, although the debt load remains high. At the state and local levels, the ongoing improvement in the overall economy is providing budgetary payoffs.
The nonresidential construction sector will derive benefits from taxes that are increasing naturally. Stronger employment and higher incomes lift income tax revenues; advances in consumer spending yield more sales taxes; and rising home prices translate into improved property taxes.
The value of construction starts each month is summarized from Reed's database of all active construction projects in the U.S. Missing project values are estimated with the help of RSMeans' building cost models.
See Reed Construction Data's full Construction Industry Snapshot here.
Related Stories
| Aug 11, 2010
PBK, DLR Group among nation's largest K-12 school design firms, according to BD+C's Giants 300 report
A ranking of the Top 75 K-12 School Design Firms based on Building Design+Construction's 2009 Giants 300 survey. For more Giants 300 rankings, visit http://www.BDCnetwork.com/Giants
| Aug 11, 2010
Turner Building Cost Index dips nearly 4% in second quarter 2009
Turner Construction Company announced that the second quarter 2009 Turner Building Cost Index, which measures nonresidential building construction costs in the U.S., has decreased 3.35% from the first quarter 2009 and is 8.92% lower than its peak in the second quarter of 2008. The Turner Building Cost Index number for second quarter 2009 is 837.
| Aug 11, 2010
AGC unveils comprehensive plan to revive the construction industry
The Associated General Contractors of America unveiled a new plan today designed to revive the nation’s construction industry. The plan, “Build Now for the Future: A Blueprint for Economic Growth,” is designed to reverse predictions that construction activity will continue to shrink through 2010, crippling broader economic growth.
| Aug 11, 2010
New AIA report on embassies: integrate security and design excellence
The American Institute of Architects (AIA) released a new report to help the State Department design and build 21st Century embassies.
| Aug 11, 2010
Section Eight Design wins 2009 Open Architecture Challenge for classroom design
Victor, Idaho-based Section Eight Design beat out seven other finalists to win the 2009 Open Architecture Challenge: Classroom, spearheaded by the Open Architecture Network. Section Eight partnered with Teton Valley Community School (TVCS) in Victor to design the classroom of the future. Currently based out of a remodeled house, students at Teton Valley Community School are now one step closer to getting a real classroom.


