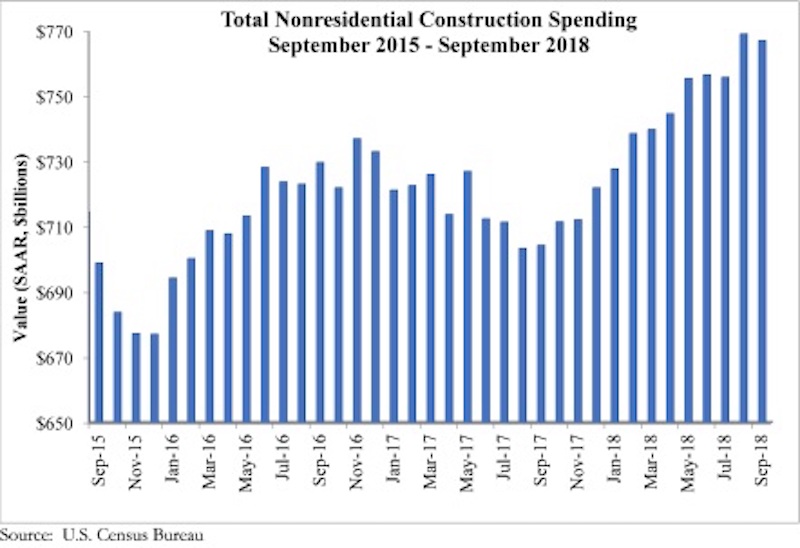
National nonresidential construction spending fell 0.3% in September but remains historically elevated, according to an Associated Builders and Contractors analysis of U.S. Census Bureau data released today. Total nonresidential spending stood at $767.1 billion on a seasonally adjusted, annualized rate in September, an increase of 8.9% on a year-ago basis.
Note that August’s estimate was revised almost a full percent higher from $762.7 billion to $769.1 billion, the highest level in the history of the series. Private nonresidential spending increased 0.1% in September while public nonresidential spending decreased 0.8% for the month.
“Virtually no weight should be placed upon the monthly decline in nonresidential construction spending that occurred in September,” said ABC Chief Economist Anirban Basu. “Rather, we should focus on the massive upward revision to August’s spending data. That revision finally aligns construction spending data with statistics on backlog, employment and other indicators of robust nonresidential construction spending. On a year-over-year basis, nonresidential construction is up nearly 9%, an impressive performance by any standard.
“Unlike previous instances of rapid construction growth, this one is led by a neatly balanced combination of private and public spending growth,” said Basu. “Among the leading sources of spending growth over the past year are water supply, transportation, lodging and office construction. This is not only consistent with an economy that continues to perform splendidly along multiple dimensions, but also with significantly improved state and local government finances, which has helped to support greater levels of infrastructure spending.
“Given healthy backlog and indications that the economy will continue to manifest momentum into 2019, contractors can expect to remain busy,” said Basu. “The most substantial challenges will continue to be rising workforce and input costs. That said, there are indications of softening business investment, which could serve to weaken U.S. economic growth after what is setting up to be a strong first half of 2019.”
Related Stories
MFPRO+ Research | Oct 15, 2024
Multifamily rents drop in September 2024
The average multifamily rent fell by $3 in September to $1,750, while year-over-year growth was unchanged at 0.9 percent.
Contractors | Oct 1, 2024
Nonresidential construction spending rises slightly in August 2024
National nonresidential construction spending increased 0.1% in August, according to an Associated Builders and Contractors analysis of data published today by the U.S. Census Bureau. On a seasonally adjusted annualized basis, nonresidential spending totaled $1.22 trillion.
The Changing Built Environment | Sep 23, 2024
Half-century real estate data shows top cities for multifamily housing, self-storage, and more
Research platform StorageCafe has conducted an analysis of U.S. real estate activity from 1980 to 2023, focusing on six major sectors: single-family, multifamily, industrial, office, retail, and self-storage.
Student Housing | Sep 17, 2024
Student housing market stays strong in summer 2024
As the summer season winds down, student housing performance remains strong. Preleasing for Yardi 200 schools rose to 89.2% in July 2024, falling just slightly behind the same period last year.
MFPRO+ Research | Sep 11, 2024
Multifamily rents fall for first time in 6 months
Ending its six-month streak of growth, the average advertised multifamily rent fell by $1 in August 2024 to $1,741.
Contractors | Sep 10, 2024
The average U.S. contractor has 8.2 months worth of construction work in the pipeline, as of August 2024
Associated Builders and Contractors reported today that its Construction Backlog Indicator fell to 8.2 months in August, according to an ABC member survey conducted Aug. 20 to Sept. 5. The reading is down 1.0 months from August 2023.
Construction Costs | Sep 2, 2024
Construction material decreases level out, but some increases are expected to continue for the balance Q3 2024
The Q3 2024 Quarterly Construction Insights Report from Gordian examines the numerous variables that influence material pricing, including geography, global events and commodity volatility. Gordian and subject matter experts examine fluctuations in costs, their likely causes, and offer predictions about where pricing is likely to go from here. Here is a sampling of the report’s contents.
Contractors | Aug 21, 2024
The average U.S. contractor has 8.4 months worth of construction work in the pipeline, as of July 2024
Associated Builders and Contractors reported today that its Construction Backlog Indicator held steady at 8.4 months in July, according to an ABC member survey conducted July 22 to Aug. 6. The reading is down 0.9 months from July 2023.
MFPRO+ Research | Aug 9, 2024
Apartment completions to surpass 500,000 for first time ever
While the U.S. continues to maintain a steady pace of delivering new apartments, this year will be one for the record books.
Contractors | Aug 1, 2024
Nonresidential construction spending decreased 0.2% in June
National nonresidential construction spending declined 0.2% in June, according to an Associated Builders and Contractors analysis of data published today by the U.S. Census Bureau. On a seasonally adjusted annualized basis, nonresidential spending totaled $1.21 trillion. Nonresidential construction has expanded 5.3% from a year ago.


