The number of architects licensed in the United States rose to 115,316 in 2018, according to the annual Survey of Architectural Registration Boards. This is a 2% increase from 2017 and represents a 13% increase compared to the number of U.S. architects seen a decade ago.
Conducted annually by the National Council of Architectural Registration Boards (NCARB), the survey provides exclusive insight into data from the architectural licensing boards of the 50 U.S. states, the District of Columbia, Guam, Puerto Rico, and the U.S. Virgin Islands, as well as the Northern Mariana Islands, which rejoined NCARB in 2018.
The increase in the number of architects is even more apparent when compared to the U.S. population: While the number of architects licensed in the U.S. has risen over 13% in the last decade, the total U.S. population has risen just 7%, according to data from the U.S. Census Bureau.
“This year’s data suggests that the profession is healthy and growing—and that NCARB’s services are just as important now as they were when our organization was founded 100 years ago,” said NCARB CEO Michael J. Armstrong.
Additional data from the upcoming 2019 NCARB by the Numbers regarding NCARB’s 100 years of history reflects the increased demand for the organization’s services. There are now over 115,000 individuals who hold an active NCARB Record, including nearly 41,000 candidates pursuing architectural licensure—a 1% increase in both Record holders and candidates compared to 2017.
The 2018 Survey of Architectural Registration Boards also reveals that there continue to be more reciprocal (outof-state) licenses than resident licenses issued in the U.S. There were 125,475 reciprocal licenses reported in 2018, which is largely unchanged from the amount seen in 2017. The steady number of reciprocal licenses indicates the effectiveness of the mobility pathway established by NCARB and the architectural licensing boards.
The survey reflects registration data from January to December 2018. Additional data on the path to licensure will be available in July’s 2019 edition of NCARB by the Numbers. To learn more about NCARB’s data and the Survey of Architectural Registration Boards, visit www.ncarb.org.

Related Stories
Market Data | Mar 29, 2017
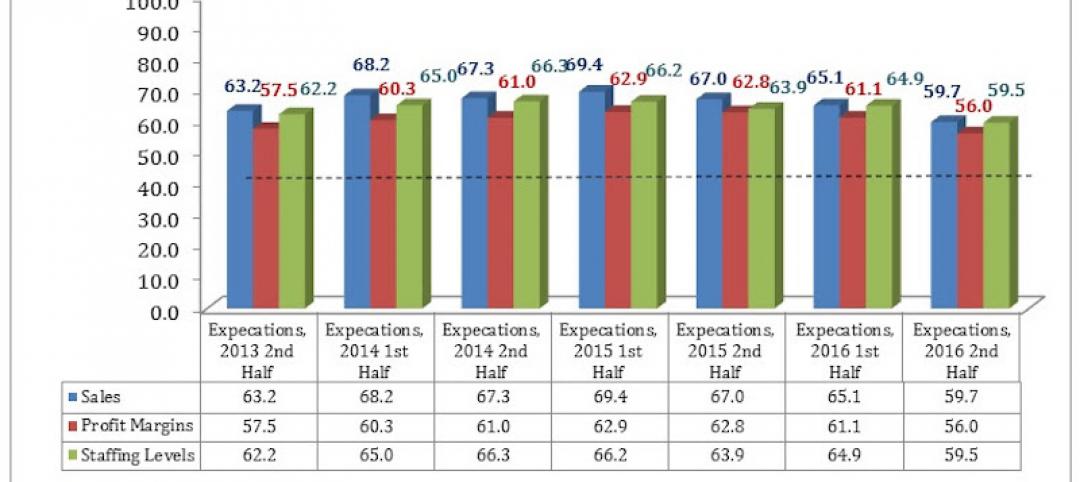
Contractor confidence ends 2016 down but still in positive territory
Although all three diffusion indices in the survey fell by more than five points they remain well above the threshold of 50, which signals that construction activity will continue to be one of the few significant drivers of economic growth.
Market Data | Mar 24, 2017
These are the most and least innovative states for 2017
Connecticut, Virginia, and Maryland are all in the top 10 most innovative states, but none of them were able to claim the number one spot.
Market Data | Mar 22, 2017
After a strong year, construction industry anxious about Washington’s proposed policy shifts
Impacts on labor and materials costs at issue, according to latest JLL report.
Market Data | Mar 22, 2017
Architecture Billings Index rebounds into positive territory
Business conditions projected to solidify moving into the spring and summer.
Market Data | Mar 15, 2017
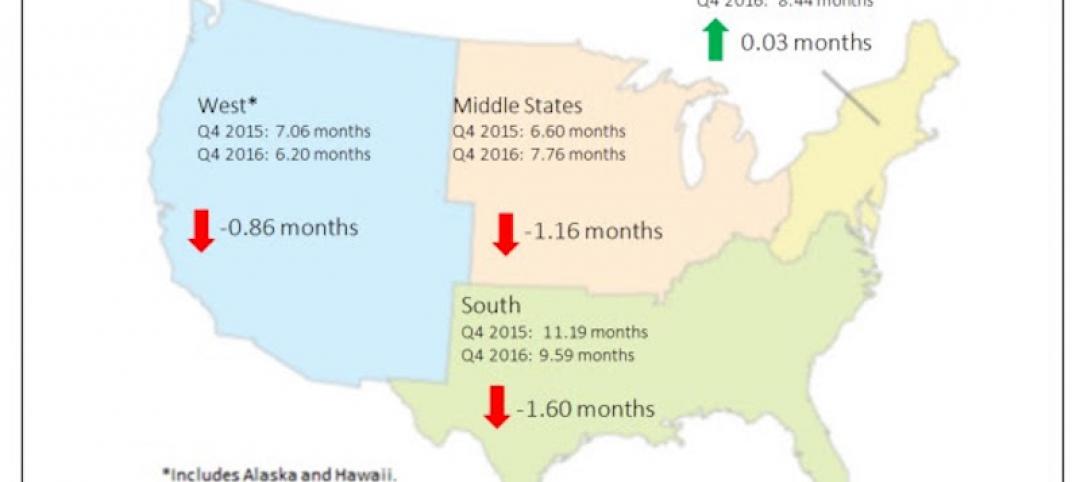
ABC's Construction Backlog Indicator fell to end 2016
Contractors in each segment surveyed all saw lower backlog during the fourth quarter, with firms in the heavy industrial segment experiencing the largest drop.
Market Data | Feb 28, 2017
Leopardo’s 2017 Construction Economics Report shows year-over-year construction spending increase of 4.2%
The pace of growth was slower than in 2015, however.
Market Data | Feb 23, 2017
Entering 2017, architecture billings slip modestly
Despite minor slowdown in overall billings, commercial/ industrial and institutional sectors post strongest gains in over 12 months.
Market Data | Feb 16, 2017
How does your hospital stack up? Grumman/Butkus Associates 2016 Hospital Benchmarking Survey
Report examines electricity, fossil fuel, water/sewer, and carbon footprint.
Market Data | Feb 1, 2017
Nonresidential spending falters slightly to end 2016
Nonresidential spending decreased from $713.1 billion in November to $708.2 billion in December.
Market Data | Jan 31, 2017
AIA foresees nonres building spending increasing, but at a slower pace than in 2016
Expects another double-digit growth year for office construction, but a more modest uptick for health-related building.


