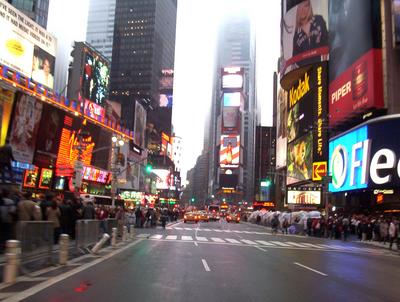
The Building Owners and Managers Association (BOMA) International has identified the most expensive commercial real estate markets in the U.S. The data is drawn from the 2011 Experience Exchange Report (EER), which provides an annual analysis of the office building operating income and expense data compiled across approximately 940 million square feet of commercial office space in more than 6,500 buildings in 278 different markets. The 2011 report is based on operating income and expenses from 2010.
The most expensive U.S. cities, based on total rental income, include:
- New York, N.Y., $48.27 per square foot (psf)
- Washington, D.C., $42.63 psf
- San Mateo, Calif., $41.61 psf
- Santa Monica, Calif., $36.67 psf
- San Francisco, Calif., $34.86 psf
- Boston, Mass., $31.15 psf
- San Jose, Calif., $30.35 psf
- Los Angeles, Calif., $27.97 psf
- West Palm Beach, Fla., $27.71 psf
- Chicago, Ill., $25.20 psf
Total rental income includes rental income from office, retail, and other space, which includes storage areas. Amid the economic downturn in real estate markets, few markets demonstrated significant increases in rental income, suggesting that rental rates remain relatively stable and favorable for tenants seeking to pursue new leases or renegotiate existing ones. Among the most expensive cities, only New York and San Francisco showed increases in rental income.
Gauging most expensive cities on the basis of total operating and fixed expenses produces a slightly different list:
- New York, N.Y., $21.44 psf
- Washington, D.C., $16.86 psf
- Boston, Mass., $15.16 psf
- Morristown, N.J., $14.67 psf
- San Francisco, Calif., $14.43 psf
- Miami, Fla., $12.87 psf
- Santa Monica, Calif., $12.84 psf
- Plainfield, N.J., $12.83 psf
- Chicago, Ill. and Los Angeles, Calif., 12.49 psf
- Newark, N.J., $12.46 psf
Total operating expenses includes all expenses incurred to operate office buildings, including utilities, repairs/maintenance, cleaning, administrative, security and roads and grounds. Fixed expenses include real estate taxes, property taxes and insurance. In New York, average total operating plus fixed expenses were $21.44 per square foot (psf), while in Los Angeles, they averaged $12.96 psf. Operating expenses increased in most markets in the last year. Fixed expenses were volatile, which could be attributed in part to rising utility costs as well as rising real estate taxes. While many cash-constrained cities and municipalities are looking to real estate for tax revenue, many property owners are contesting tax assessments because asset values have decreased due to the economic downturn. BD+C
Related Stories
Higher Education | Aug 7, 2023
Building a better academic workplace
Gensler's David Craig and Melany Park show how agile, efficient workplaces bring university faculty and staff closer together while supporting individual needs.
University Buildings | Aug 7, 2023
Eight-story Vancouver Community College building dedicated to clean energy, electric vehicle education
The Centre for Clean Energy and Automotive Innovation, to be designed by Stantec, will house classrooms, labs, a library and learning center, an Indigenous gathering space, administrative offices, and multiple collaborative learning spaces.
Green | Aug 7, 2023
Rooftop photovoltaic panels credited with propelling solar energy output to record high
Solar provided a record-high 7.3% of U.S. electrical generation in May, “driven in large part by growth in ‘estimated’ small-scale (e.g., rooftop) solar PV whose output increased by 25.6% and accounted for nearly a third (31.9%) of total solar production,” according to a report by the U.S. Energy Information Administration.
Resiliency | Aug 7, 2023
Creative ways cities are seeking to beat urban heat gain
As temperatures in many areas hit record highs this summer, cities around the world are turning to creative solutions to cope with the heat. Here are several creative ways cities are seeking to beat urban heat gain.
Government Buildings | Aug 7, 2023
Nearly $1 billion earmarked for energy efficiency upgrades to federal buildings
The U.S. General Services Administration (GSA) recently announced plans to use $975 million in Inflation Reduction Act funding for energy efficiency and clean energy upgrades to federal buildings across the country. The investment will impact about 40 million sf, or about 20% of GSA’s federal buildings portfolio.
MFPRO+ New Projects | Aug 4, 2023
Nashville gets 'first-of-its-kind' residential tower
Global architecture firm Goettsch Partners announces the completion of Alcove, a new 356-unit residential tower in Nashville, Tenn., developed by Giarratana LLC.
Industrial Facilities | Aug 3, 2023
The state of battery manufacturing in the era of EV
One of the most significant changes seen in today’s battery plant is the full manufacturing process—from raw materials to the fully operational battery.
Government Buildings | Aug 2, 2023
A historic courthouse in Charlotte is updated and expanded by Robert A.M. Stern Architects
Robert A.M. Stern Architects’ design retains the original building’s look and presence.
Hotel Facilities | Aug 2, 2023
Top 5 markets for hotel construction
According to the United States Construction Pipeline Trend Report by Lodging Econometrics (LE) for Q2 2023, the five markets with the largest hotel construction pipelines are Dallas with a record-high 184 projects/21,501 rooms, Atlanta with 141 projects/17,993 rooms, Phoenix with 119 projects/16,107 rooms, Nashville with 116 projects/15,346 rooms, and Los Angeles with 112 projects/17,797 rooms.
Architects | Aug 1, 2023
Ware Malcomb announces hire of Jason Golub as Regional Director
In this role, Golub is responsible for the overall leadership and continued growth of the office.


