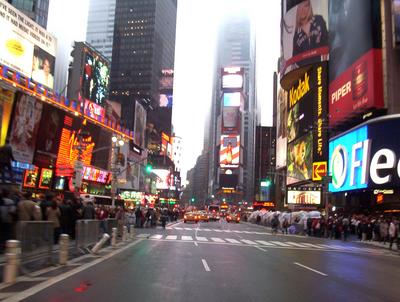
The Building Owners and Managers Association (BOMA) International has identified the most expensive commercial real estate markets in the U.S. The data is drawn from the 2011 Experience Exchange Report (EER), which provides an annual analysis of the office building operating income and expense data compiled across approximately 940 million square feet of commercial office space in more than 6,500 buildings in 278 different markets. The 2011 report is based on operating income and expenses from 2010.
The most expensive U.S. cities, based on total rental income, include:
- New York, N.Y., $48.27 per square foot (psf)
- Washington, D.C., $42.63 psf
- San Mateo, Calif., $41.61 psf
- Santa Monica, Calif., $36.67 psf
- San Francisco, Calif., $34.86 psf
- Boston, Mass., $31.15 psf
- San Jose, Calif., $30.35 psf
- Los Angeles, Calif., $27.97 psf
- West Palm Beach, Fla., $27.71 psf
- Chicago, Ill., $25.20 psf
Total rental income includes rental income from office, retail, and other space, which includes storage areas. Amid the economic downturn in real estate markets, few markets demonstrated significant increases in rental income, suggesting that rental rates remain relatively stable and favorable for tenants seeking to pursue new leases or renegotiate existing ones. Among the most expensive cities, only New York and San Francisco showed increases in rental income.
Gauging most expensive cities on the basis of total operating and fixed expenses produces a slightly different list:
- New York, N.Y., $21.44 psf
- Washington, D.C., $16.86 psf
- Boston, Mass., $15.16 psf
- Morristown, N.J., $14.67 psf
- San Francisco, Calif., $14.43 psf
- Miami, Fla., $12.87 psf
- Santa Monica, Calif., $12.84 psf
- Plainfield, N.J., $12.83 psf
- Chicago, Ill. and Los Angeles, Calif., 12.49 psf
- Newark, N.J., $12.46 psf
Total operating expenses includes all expenses incurred to operate office buildings, including utilities, repairs/maintenance, cleaning, administrative, security and roads and grounds. Fixed expenses include real estate taxes, property taxes and insurance. In New York, average total operating plus fixed expenses were $21.44 per square foot (psf), while in Los Angeles, they averaged $12.96 psf. Operating expenses increased in most markets in the last year. Fixed expenses were volatile, which could be attributed in part to rising utility costs as well as rising real estate taxes. While many cash-constrained cities and municipalities are looking to real estate for tax revenue, many property owners are contesting tax assessments because asset values have decreased due to the economic downturn. BD+C
Related Stories
| Aug 11, 2010
City of Anaheim selects HOK Los Angeles and Parsons Brinckerhoff to design the Anaheim Regional Transportation Intermodal Center
The Los Angeles office of HOK, a global architecture design firm, and Parsons Brinckerhoff, a global infrastructure strategic consulting, engineering and program/construction management organization, announced its combined team was selected by the Anaheim City Council and Orange County Transportation Authority (OCTA) to design phase one of the Anaheim Regional Transportation Intermodal Center.
| Aug 11, 2010
GBCI launches credentialing maintenance program for current LEED APs
The Green Building Certification Institute (GBCI) launched a credentialing maintenance program (CMP) for LEED APs and Green Associates, ensuring that LEED professional credentials will remain relevant and meaningful in a rapidly evolving marketplace.
| Aug 11, 2010
Construction employment shrinks in 319 of the nation's 336 largest metro areas in July, continuing months-long slide
Construction workers in communities across the country continued to suffer extreme job losses this July according to a new analysis of metropolitan area employment data from the Bureau of Labor Statistics released today by the Associated General Contractors of America. That analysis found construction employment declined in 319 of the nation’s largest communities while only 11 areas saw increases and six saw no change in construction employment between July 2008 and July 2009.
| Aug 11, 2010
Green consultant guarantees LEED certification or your money back
With cities mandating LEED (Leadership in Energy and Environmental Design) certification for public, and even private, buildings in growing numbers, an Atlanta-based sustainability consulting firm is hoping to ease anxieties over meeting those goals with the industry’s first Green Guaranteed.
| Aug 11, 2010
Architecture Billings Index bounces back after substantial dip
Exhibiting a welcome rebound following a 5-point dip the month prior, the Architecture Billings Index (ABI) was up almost 6 points in July. As a leading economic indicator of construction activity, the ABI reflects the approximate nine to twelve month lag time between architecture billings and construction spending. The American Institute of Architects (AIA) reported the July ABI rating was 43.1, up noticeably from 37.7 the previous month.
| Aug 11, 2010
Rafael Vinoly-designed East Wing opens at Cleveland Museum of Art
Rafael Vinoly Architects has designed the new East Wing at the Cleveland Museum of Art (CMA), Ohio, which opened to the public on June 27, 2009. Its completion marks the opening of the first of three planned wings.
| Aug 11, 2010
National Association of Governors adopts AIA policy of reaching carbon neutrality in buildings by 2030
As part of their comprehensive national Energy Conservation and Improved Energy Efficiency policy, the National Association of Governors (NGA) has adopted the promotion of carbon neutral new and renovated buildings by 2030 as outlined by the American Institute of Architects (AIA).


