Lodging Econometrics (LE) recently released the Global Construction Pipeline Trend Report, which compiles the construction pipeline for every country and market in the world. Currently, the top world regions by project count are North America with 5,239 Projects/639,712 Rooms, Asia Pacific with 4,233 Projects/903,415 Rooms and EMEA with 2,100 Projects/395,506 Rooms.
The top countries by project-count are the United States with 5,011 Projects/608,837 Rooms and China with 2,435 Projects/538,836 Rooms. The U.S. accounts for 40% of the projects in the Global Pipeline while China accounts for 20%, resulting in 60% of the Global Pipeline being concentrated in just two countries.
The cities with the largest pipeline project count are: New York with 181 Projects/30,225 Rooms, Houston with 148 Projects/16,398 Rooms, Dubai with 145 Projects/40,733 Rooms, Dallas with 143 Projects/17,580 Rooms and Seoul 126 Projects/22,199 Rooms.
Related Stories
Market Data | Apr 18, 2019
ABC report: 'Confidence seems to be making a comeback in America'
The Construction Confidence Index remained strong in February, according to the Associated Builders and Contractors.
Market Data | Apr 16, 2019
ABC’s Construction Backlog Indicator rebounds in February
ABC's Construction Backlog Indicator expanded to 8.8 months in February 2019.
Market Data | Apr 8, 2019
Engineering, construction spending to rise 3% in 2019: FMI outlook
Top-performing segments forecast in 2019 include transportation, public safety, and education.
Market Data | Apr 1, 2019
Nonresidential spending expands again in February
Private nonresidential spending fell 0.5% for the month and is only up 0.1% on a year-over-year basis.
Market Data | Mar 22, 2019
Construction contractors regain confidence in January 2019
Expectations for sales during the coming six-month period remained especially upbeat in January.
Market Data | Mar 21, 2019
Billings moderate in February following robust New Year
AIA’s Architecture Billings Index (ABI) score for February was 50.3, down from 55.3 in January.
Market Data | Mar 19, 2019
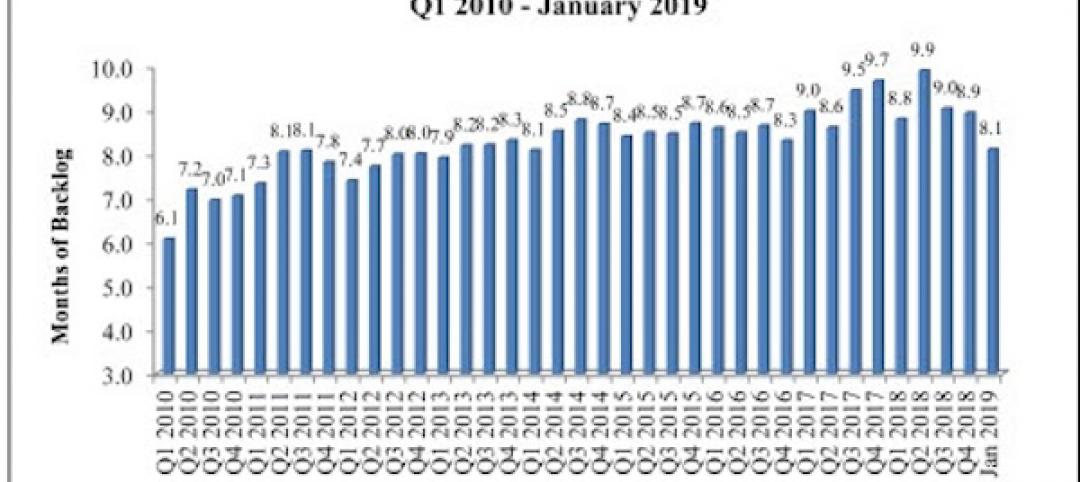
ABC’s Construction Backlog Indicator declines sharply in January 2019
The Construction Backlog Indicator contracted to 8.1 months during January 2019.
Market Data | Mar 15, 2019
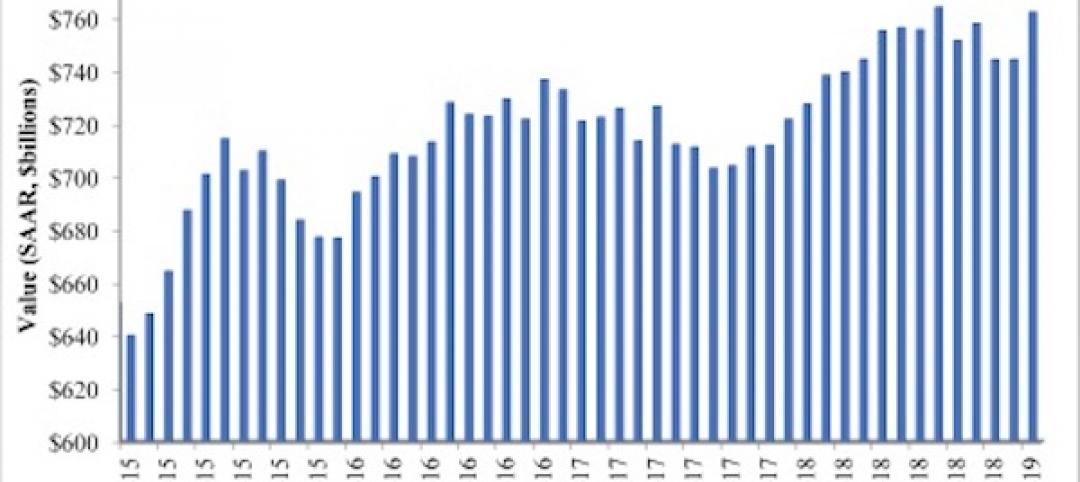
2019 starts off with expansion in nonresidential spending
At a seasonally adjusted annualized rate, nonresidential spending totaled $762.5 billion for the month.
Market Data | Mar 14, 2019
Construction input prices rise for first time since October
Of the 11 construction subcategories, seven experienced price declines for the month.
Market Data | Mar 6, 2019
Global hotel construction pipeline hits record high at 2018 year-end
There are a record-high 6,352 hotel projects and 1.17 million rooms currently under construction worldwide.


