The U.S. Energy Information Administration has posted preliminary results from its periodic Commercial Buildings Energy Consumption survey. Data for the project were collected in 2012 and detailed analyses of energy consumption will be released beginning next spring. The project includes buildings >1,000 sf that devote more than half of their floorspace to activity that is not residential, manufacturing, industrial, or agricultural.
The preliminary results from the Commercial Buildings Energy Consumption Survey (CBECS) show that there were 5.6 million commercial buildings in the United States in 2012, comprising 87.4 billion square feet of floorspace. This represents a 14% increase in the number of buildings and a 22% increase in floorspace since 2003, the last year for which CBECS results are available.
The preliminary data can be found in this summary table of building counts and total square footage by building size category, principal building activity, year of construction category, Census region, and Census division. The first tab provides the estimates; the second tab on the table provides relative standard errors (RSEs) for the estimates.
For comparison, there is a similar summary table from the 2003 CBECS. Other file formats for the same table can be accessed from the 2003 CBECS data page.
The size, use, vintage, and geographic region of a building are among the key determinants that influence its energy use. Subsequent releases will show more detailed characteristics and crosstabulations among key categories. This is the first release of many reports and data releases expected for the 2012 CBECS; these preliminary tables provide a first look at the building stock and the attributes that drive commercial energy use.
Trends – 1979 to 2012: Growth in building size outpaces increases in building stock
Since the first CBECS was conducted in 1979 to the current 2012 CBECS, the number of buildings has increased from 3.8 million to 5.6 million, and the amount of commercial floorspace has increased from 51 billion to 87 billion square feet.

HOW DOES EIA PRODUCE RELIABLE RESULTS FROM A SAMPLE SURVEY?
The CBECS is a national sample survey. See How Were Buildings Selected for the 2012 CBECS? for an overview of the sampling process. After the sample was selected, preparations for the interviewing phase began. In April 2013, about 250 field interviewers were trained to visit buildings across the United States and recruit respondents knowledgeable about energy use in the buildings. After recruiting a respondent at a building, the field interviewer’s job was to conduct an interview on a laptop computer asking questions about the building’s structure, use, energy equipment, and energy use. Between April and November 2013, interviews were conducted in-person or by telephone at over 6,500 buildings nationwide. Because every building had a chance to be selected and that chance is known, a sample weight can be assigned to each case. The resulting dataset is representative of the entire U.S. commercial building population.
Principal building activities: The most prevalent building types account for the majority of the total buildings and floorspace, while the building types with the largest average buildings are less common in the building stock
The commercial building sector is characterized by diversity. The 2012 survey identified more than 100 subcategories of building activity, which are aggregated into the 14 principal building activities shown in the summary table and in the figures below. CBECS includes buildings as small and singular in activity as a freestanding bank or fast food restaurant, to buildings as large and complex as an office building with hundreds of tenants or a major airport terminal. CBECS also includes vacant buildings; some vacant buildings use energy, either for maintenance purposes or because a small amount of space is still used in the building1.

Among the general building activities, lodging, education, and health care are the largest buildings, on average. The health care category's average is greatly affected by the size of inpatient health care buildings (i.e., hospitals), which have an average size of 247,700 square feet per building, compared to outpatient health care buildings, which have an average size of 12,100 square feet.

Figure 4 tracks changes in the building stock over the past 10 years by comparing the number of buildings for each principal building activity from 2003 to 2012. The highest percent of growth was in vacant buildings and other types of buildings, which includes buildings such as airplane hangars, laboratories and data centers. Warehouses, food service buildings, public assembly, and office buildings also increased between 2003 and 2012, while food sales buildings (e.g., grocery and convenience stores) showed a decrease,2 and mercantile (retail and malls) showed a decrease, although it is not statistically significant. Because CBECS is a sample survey, each estimate has sampling error associated with it, which should be considered when comparing estimates. See What is an RSE? and Estimation of Standard Errors for more information.

Size of buildings: Although there are relatively few very large buildings (over 100,000 square feet of floorspace), they account for more than one-third of total commercial building floorspace
Commercial buildings are often depicted showing a skyline of towering buildings. However, the vast majority of commercial buildings are relatively small. Just less than half of buildings are 5,000 square feet in size or smaller, and nearly three-fourths are 10,000 square feet or smaller. The median building size is 5,100 square feet (i.e., half the buildings are larger than this and half are smaller), while the average size is 15,700 square feet. The average is larger than the median because of the influence of a small number of very large buildings; buildings over 100,000 square feet make up only about 2% of the building count but about 35% of the total floorspace.

Year constructed: The commercial building stock is middle-aged, and newer buildings are larger than older ones
Commercial buildings remain in use for many decades. Although about 12% of commercial buildings (comprising 14% of commercial floorspace) were built in the past 10 years, the commercial building stock is still fairly old, with about half of all buildings constructed at least 35 years ago. However, in the existing building stock, there are more buildings built in the 2000s than buildings built prior to 1946.

Newer buildings tend to be larger than older buildings. The average building size for those constructed before 1960 is 12,000 square feet; buildings constructed between 1960 and 1999 average 16,300 square feet; and buildings constructed in the 2000s average 19,100 square feet. The differences between these average building sizes are statistically significant.

Census region and division (see map): The South has the most commercial buildings, but the Northeast has the largest commercial buildings
The South Census region, the most populous of the four Census regions, has the largest percentage of commercial buildings and commercial floorspace, with about 40% of both total buildings and floorspace. The Midwest and West regions each account for more than one-fifth of commercial buildings and floorspace.

Buildings in the Northeast region are, on average, 4,000 to 5,000 square feet larger than buildings in the other regions. The Northeast region includes the Middle Atlantic division (New York, Pennsylvania, and New Jersey), where buildings average 22,400 square feet.

Footnote
1 CBECS principal building activity is defined as the activity occupying the most floorspace. Respondents are first asked if there is one activity that occupies 75% or more of the floorspace. If not, CBECS collects the top three building activities and their corresponding percents and the principal activity is assigned as the one comprising the most floorspace.
2 Estimates for number of food sales buildings can be somewhat misleading because grocery stores and convenience stores are often part of strip malls and therefore included in the "Enclosed and strip malls" category in CBECS. "Enclosed and strip malls" is a subcategory of "Mercantile" and is shown in the summary table.
Specific questions on this product may be directed to Joelle Michaels.
Related Stories
| Mar 16, 2011
AIA offers assistance to Japan's Architects, U.S. agencies coordinating disaster relief
“Our hearts go out to the people of Japan as a result of this horrific earthquake and tsunami,” said Clark Manus, FAIA, 2011 President of the AIA. “We are in contact with our colleagues at AIA Japan and the Japan Institute of Architects to offer not only our condolences but our profession's technical and professional expertise when the initiative begins focusing on rebuilding."
| Mar 16, 2011
Are you working on a fantastic residence hall project? Want to tell us about it?
The feature story for the May 2011 issue of Building Design+Construction will focus on new trends in university residence hall design and construction, and we’re looking for great projects to report on and experts to interview. Projects can involve new construction or remodeling/reconstruction work, and can be recently completed, currently under construction, or still on the boards.
| Mar 16, 2011
Foster + Partners to design carbon-neutral urban park for West Kowloon Cultural District in Hong Kong
Foster + Partners has been selected by the board of the West Kowloon Cultural District Authority to design a massive 56-acre urban park on a reclaimed harbor-front site in Hong Kong. Designed as a carbon-neutral development, “City Park” will seamlessly blend into existing streets while creating large expanses of green space and seventeen new cultural venues.
| Mar 15, 2011
What Starbucks taught us about redesigning college campuses
Equating education with a cup of coffee might seem like a stretch, but your choice of college, much like your choice of coffee, says something about the ability of a brand to transform your day. When Perkins + Will was offered the chance to help re-think the learning spaces of Miami Dade College, we started by thinking about how our choice of morning coffee has changed over the years, and how we could apply those lessons to education.
| Mar 15, 2011
What will the architecture profession look like in 2025?
The global economy and the economic recession have greatly affected architecture firms' business practices. A Building Futures survey from the Royal Institute of British Architects looks at how these factors will have transformed the profession and offers a glimpse of future trends. Among the survey's suggestions: not only will architecture firms have to focus on a financial and business approach rather than predominantly design-led offices, but also company names are predicted to drop ‘architect’ altogether.
| Mar 15, 2011
Passive Strategies for Building Healthy Schools, An AIA/CES Discovery Course
With the downturn in the economy and the crash in residential property values, school districts across the country that depend primarily on property tax revenue are struggling to make ends meet, while fulfilling the demand for classrooms and other facilities.
| Mar 14, 2011
Renowned sustainable architect Charles D. Knight to lead Cannon Design’s Phoenix office
Cannon Design is pleased to announce that Charles D. Knight, AIA, CID, LEED AP, has joined the firm as principal. Knight will serve as the leader of the Phoenix office with a focus on advancing the firm’s healthcare practice. Knight brings over 25 years of experience and is an internationally recognized architect who has won numerous awards for his unique contributions to the sustainable and humanistic design of healthcare facilities.
| Mar 11, 2011
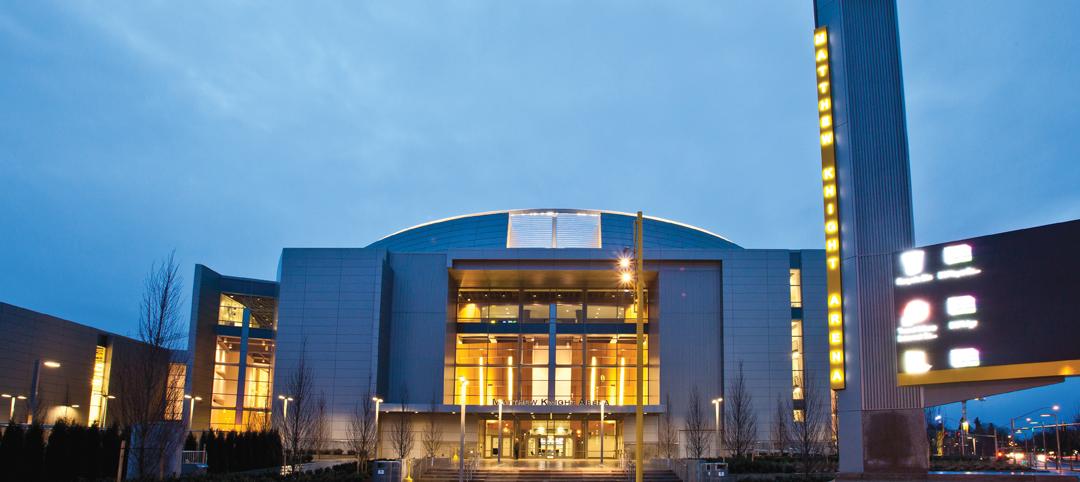
University of Oregon scores with new $227 million basketball arena
The University of Oregon’s Matthew Knight Arena opened January 13 with a men’s basketball game against USC where the Ducks beat the Trojans, 68-62. The $227 million arena, which replaces the school’s 84-year-old McArthur Court, has a seating bowl pitched at 36 degrees to replicate the close-to-the-action feel of the smaller arena it replaced, although this new one accommodates 12,364 fans.
| Mar 11, 2011
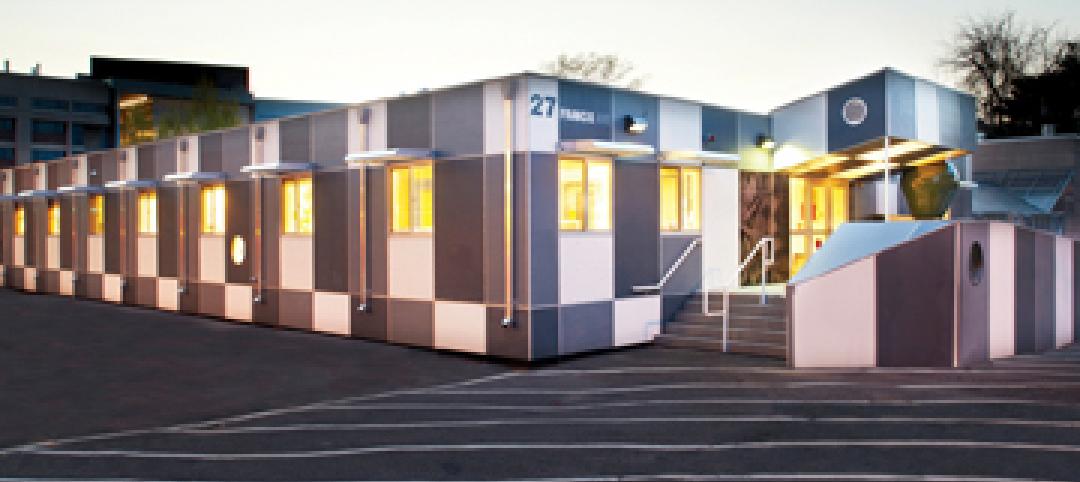
Temporary modular building at Harvard targets sustainability
Anderson Anderson Architecture of San Francisco designed the Harvard Yard childcare facility, a modular building manufactured by Triumph Modular of Littleton, Mass., that was installed at Harvard University. The 5,700-sf facility will remain on the university’s Cambridge, Mass., campus for 18 months while the Harvard Yard Child Care Center and the Oxford Street Daycare Coop are being renovated.
| Mar 11, 2011
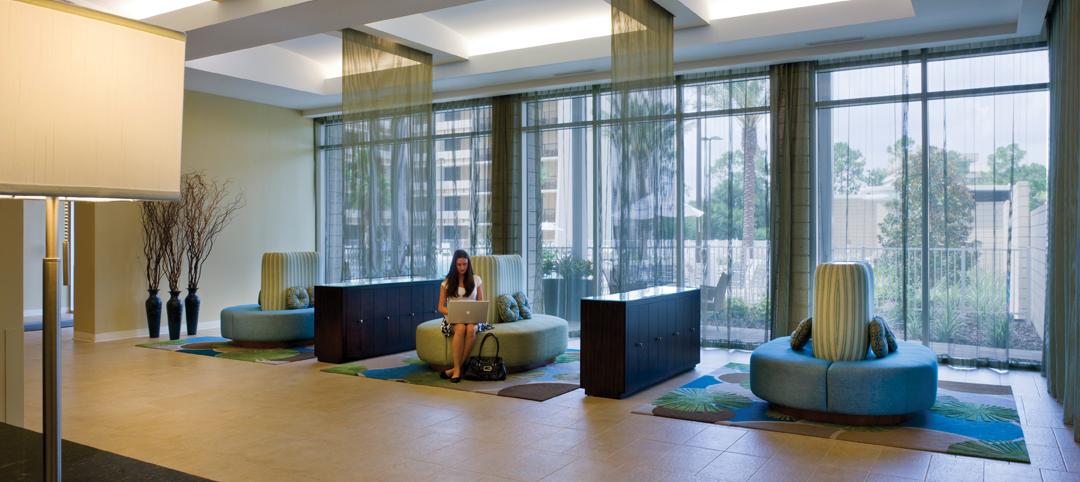
Holiday Inn reworked for Downtown Disney Resort
The Orlando, Fla., office of VOA Associates completed a comprehensive interior and exterior renovation of the 14-story Holiday Inn in the Downtown Disney Resort in Lake Buena Vista, Fla. The $25 million project involved rehabbing the hotel’s 332 guest rooms, atrium, swimming pool, restaurant, fitness center, and administrative spaces.


