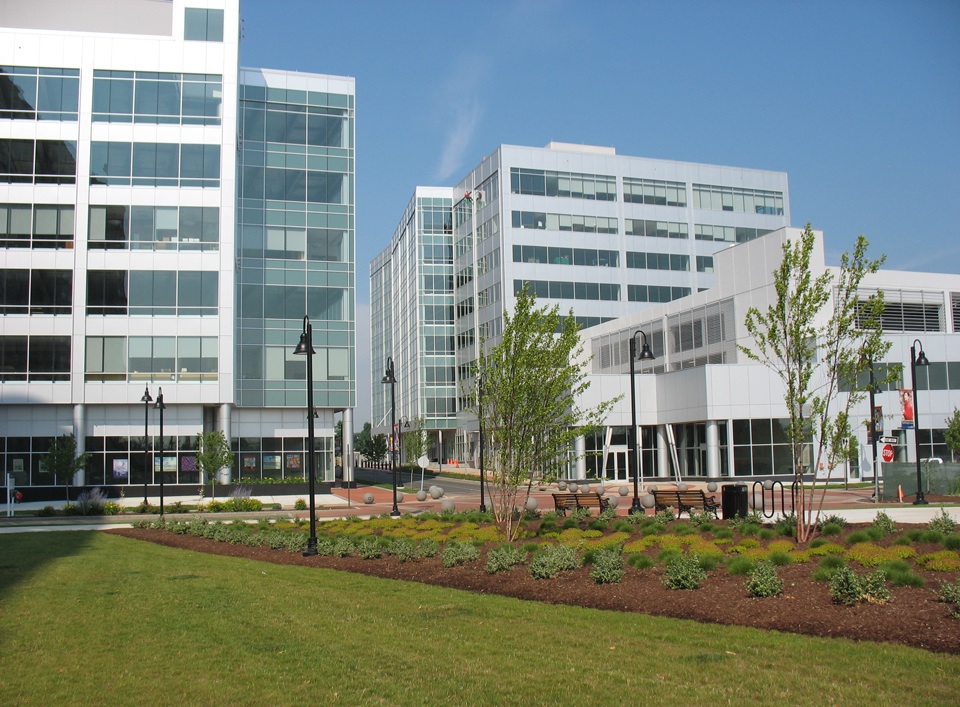
With an average cost per square foot of $16.11, Stamford, Conn., is the most costly U.S. market for commercial real estate, according to a new study by the Building Owners and Managers Association International. New York and San Francisco are also among the nation's priciest markets.
Using the results from the BOMA 2013 Experience Exchange Report, the group compiled a list of the most and least expensive commercial real estate city-markets in the United States. The annual report aggregates rental income and operating expense figures from the previous year; in 2012, data was gathered from more than 5,300 buildings across 250 markets and 115 cities in the United States and Canada.
Five most expensive city-markets – total operating expenses:
1. Stamford, Conn. $16.11 per square foot (psf)
2. New York $11.80 psf
3. Grand Rapids, Mich. $11.16 psf
4. Newark, N.J. $10.34 psf
5. San Francisco $9.66 psf
Five least expensive city-markets – total operating expenses:
1. Stockton, Calif. $3.57 psf
2. Fresno, Calif. $3.61 psf
3. Huntsville, Ala. $4.31 psf
4. Virginia Beach, Va. $4.64 psf
5. Albuquerque, N.M. $4.80 psf
Total operating expenses incorporate all expenses incurred to operate office buildings, including utilities, repairs and maintenance, roads and grounds, cleaning, administration, and security. Fixed expenses include real estate taxes, property taxes and insurance.
There was a 3.9 percent overall decrease in total operating expenses from 2011 to 2012, underscoring an industry focus on maximizing building efficiency in the face of dwindling income streams. For example, New York, which topped the list of most expensive markets for operating expenses last year, saw a decrease of $0.66 per square foot.
Five most expensive city-markets – total rental income:
1. Washington, D.C. $44.30 psf
2. New York $39.00 psf
3. San Mateo, Calif. $34.96 psf
4. San Francisco $34.49 psf
5. Santa Monica, Calif. $34.04 psf
Five least expensive city-markets – total rental income:
1. Macon, Ga. $8.16 psf
2. Shreveport, La. $11.18 psf
3. Columbus, Ohio $12.09 psf
4. Huntsville, Ala. $12.81 psf
5. Little Rock, Ark. $12.81 psf
Total rental income includes rental income from office, retail and other space, such as storage areas.
While average rental income has dropped somewhat, decreasing 2.9 percent from 2011 to 2012, building owners and managers are compensating for these income losses with greater reductions in expenses.
The Experience Exchange Report is the premier income and expense data benchmarking tool for the commercial real estate industry. The EER allows users to conduct multi-year analysis of single markets and select multiple cities to generate state and regional reports. It also offers the capability to search by building size, height, age and more for broader analysis. Subscriptions are available at www.bomaeer.com.
About BOMA International
The Building Owners and Managers Association (BOMA) International is a federation of 93 BOMA U.S. associations, BOMA Canada and its 11 regional associations and 13 BOMA international affiliates. Founded in 1907, BOMA represents the owners and managers of all commercial property types, including nearly 10 billion square feet of U.S. office space that supports 3.7 million jobs and contributes $205 billion to the U.S. GDP. Its mission is to advance the interests of the entire commercial real estate industry through advocacy, education, research, standards and information. Find BOMA online at www.boma.org.
Related Stories
| Aug 11, 2010
Integrated Project Delivery builds a brave, new BIM world
Three-dimensional information, such as that provided by building information modeling, allows all members of the Building Team to visualize the many components of a project and how they work together. BIM and other 3D tools convey the idea and intent of the designer to the entire Building Team and lay the groundwork for integrated project delivery.
| Aug 11, 2010
Great Solutions: Healthcare
11. Operating Room-Integrated MRI will Help Neurosurgeons Get it Right the First Time A major limitation of traditional brain cancer surgery is the lack of scanning capability in the operating room. Neurosurgeons do their best to visually identify and remove the cancerous tissue, but only an MRI scan will confirm if the operation was a complete success or not.
| Aug 11, 2010
Great Solutions: Collaboration
9. HOK Takes Videoconferencing to A New Level with its Advanced Collaboration Rooms To help foster collaboration among its 2,212 employees while cutting travel time, expenses, and carbon emissions traveling between its 24 office locations, HOK is fitting out its major offices with prototype videoconferencing rooms that are like no other in the U.
| Aug 11, 2010
2009 Judging Panel
A Matthew H. Johnson, PE Associate Principal Simpson Gumpertz & HegerWaltham, Mass. B K. Nam Shiu, SE, PEVP Walker Restoration Consultants Elgin, Ill. C David P. Callan, PE, CEM, LEED APSVPEnvironmental Systems DesignChicago D Ken Osmun, PA, DBIA, LEED AP Group President, ConstructionWight & Company Darien, Ill.
| Aug 11, 2010
Inspiring Offices: Office Design That Drives Creativity
Office design has always been linked to productivity—how many workers can be reasonably squeezed into a given space—but why isn’t it more frequently linked to creativity? “In general, I don’t think enough people link the design of space to business outcome,” says Janice Linster, partner with the Minneapolis design firm Studio Hive.


