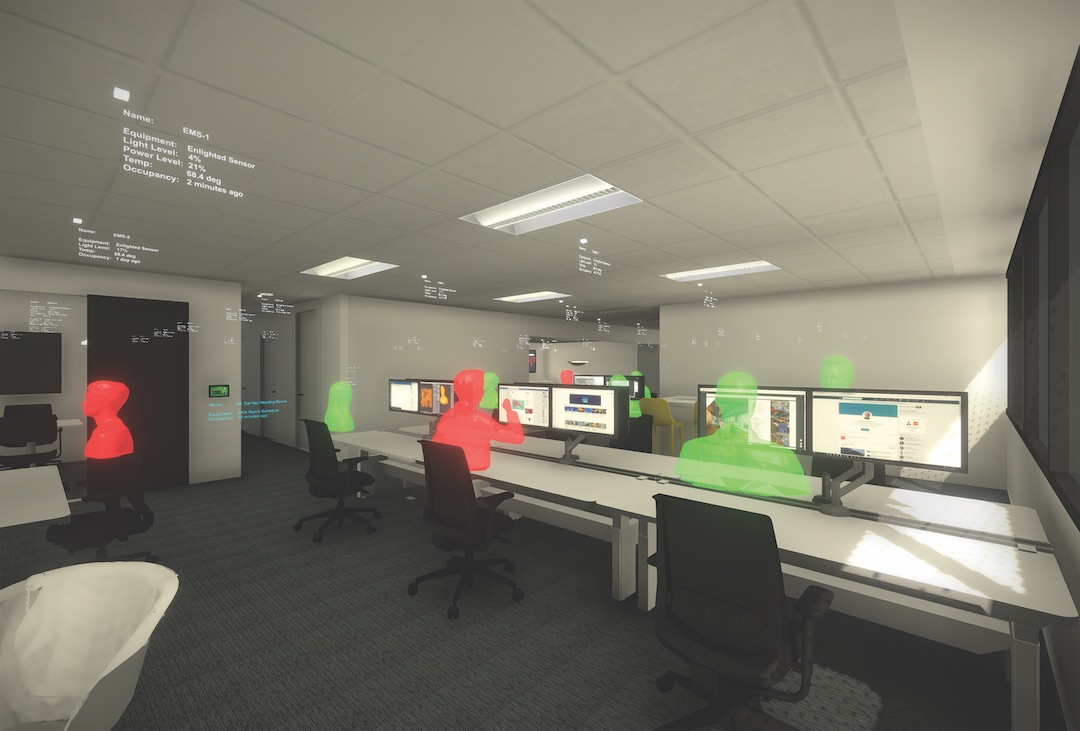
This summer, Gensler launched its newest practice, Intelligent Places, which was in development for a year and whose focus is the application of data and visual services to connect design and business results.
HMC Architects is building a data warehouse as part of a network to distribute content throughout the firm. So far, HMC has finalized the selection of servers. In phase two, the firm will put all three of its practices onto the network. An R&D component will be added in phase three.
In line with its repositioning around innovation and digital transformation, Lendlease last January hired Bill Ruh, General Electric’s Chief Digital Officer, as its CEO, Digital. At the time of the hire, Lendlease’s Managing Director Steve McCann proclaimed his company’s “leadership position in the digital space in our sector.”
These and many other AEC firms are all asking themselves the same question: How can we exploit the data that has been languishing in our computer servers for years, and sometimes decades, to produce better work and, perhaps, new revenue streams?
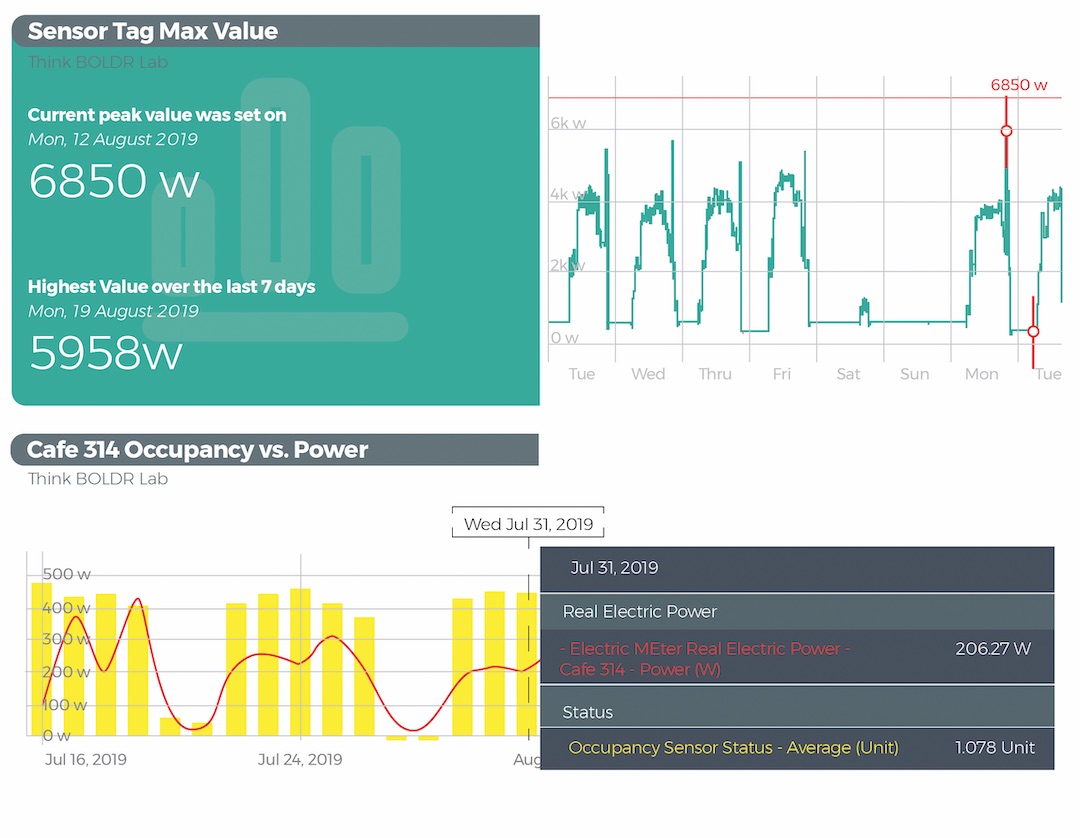 The actual data displayed of space occupancy over energy consumption. Image: WSP USA.
“Too many firms have been collecting data as a box-checking exercise. But we’re not just using data for the sake of using data,” says Jit Kee Chin, whom Suffolk Construction hired two years ago as its Chief Data Officer. “We are constantly reacting, correcting, and improving.”
Chin notes that what resonates with investors and insurers these days is risk mitigation, “because construction is a risky business.” So Suffolk has been gathering inspection-based data on jobsites to drive actions and behaviors. In March 2018, it assembled Risk X, a mobile, cloud-based safety-management tool that accommodates different data types, from human input to metadata. By using this data to identify risk, Suffolk, over a 12-month period, reduced its recordable and long-term incident rates by 40%. The firm has also used jobsite data to rewrite training manuals for clearer communication with its workers.
Building project analytics tools pave the way
Suffolk Construction is one of 17 AEC firms that BD+C interviewed in late July and early August about their practical applications of data. Those conversations inevitably came around to the question, “Why now?”
In its proposal for a presentation titled “Analytics for Operations: Putting Your Firm’s Data to Work” that it would deliver at the recent AIA conference, Leo A Daly noted that “virtually every large design firm is sitting on a mountain of practice data; 90% of it is placed on servers and never looked at again.”
That’s no exaggeration, say other firms, and is hardly a surprise when one of the biggest obstacles for AEC firms continues to be file sharing among project teams, according to recent Newforma research based on 1,154 industry respondents.
What’s been changing over the past few years, however, has been the proliferation in data analysis technologies “that is getting people excited,” says Zak Kostura, PE, Associate and Structural Engineer with Arup in New York.
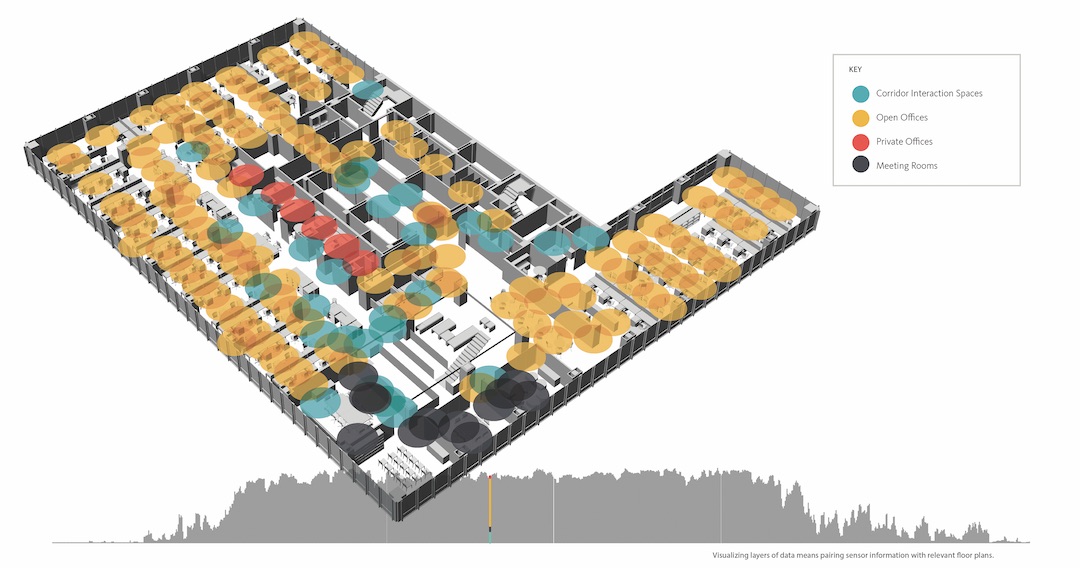 This graphic is a floor plan of Gensler’s New York office, which is studying the use of Internet-connected sensors to track things like occupancy, temperature, and energy consumption in the space. Image: Gensler.
These analytical tools are helping Building Teams and their clients spot problems and make decisions earlier.
“It isn’t a tidal wave yet, but it’s building,” says Jody Baldwin, Manager–Mid Atlantic division of Envise, a subsidiary of Southland Industries that provides open platform building management solutions. Next up, Baldwin predicts, are better communication systems and algorithms for machine learning.
Kelly Benedict, Lendlease’s Senior Vice President of Innovation and Customer Focus–Americas, thinks the fact that more AEC firms are putting their data to work is “recognition that if we don’t do this, someone else will, and maybe someone outside of the business.”
Proof beyond the rule of thumb
Richard Tyson, Director of Gensler’s Intelligent Places practice, says his firm uses data “to create better outcomes, driven by feedback.” Jacobs relies on data to add “context” to a project’s design process, says Shannon McElvaney, the firm’s Global Director of Geodesign–Advance Planning Group.
It doesn’t hurt, either, say AEC firms, to have good data in your back pocket to substantiate a project’s design ideas, costs, or programming, both internally or in conversations with clients, vendors, or building partners. “Data goes beyond the rule of thumb,” says Andrew Carruthers, Project Manager with ZGF Architects in Vancouver, B.C. “We are now able to answer questions that we previously only had feelings about, to clients and to ourselves.”
 Image: ZGF Architects.
Arup has installed accelerometers in seven buildings in New York City and London, whose output gets piped into data sets that can be merged with weather data to determine, for example, whether the firm’s assumptions about a building’s stiffness are correct.
Lori Coppenrath, Principal and Planner in DLR Group’s Justice & Civil practice in Seattle, says her firm has found pre- and post-occupancy data to be motivating factors when pitching criminal justice projects to government officials, especially those in “small counties in the middle of nowhere that don’t want to do anything.” In turn, those same municipalities could use the data to justify the expense of projects to taxpayers.
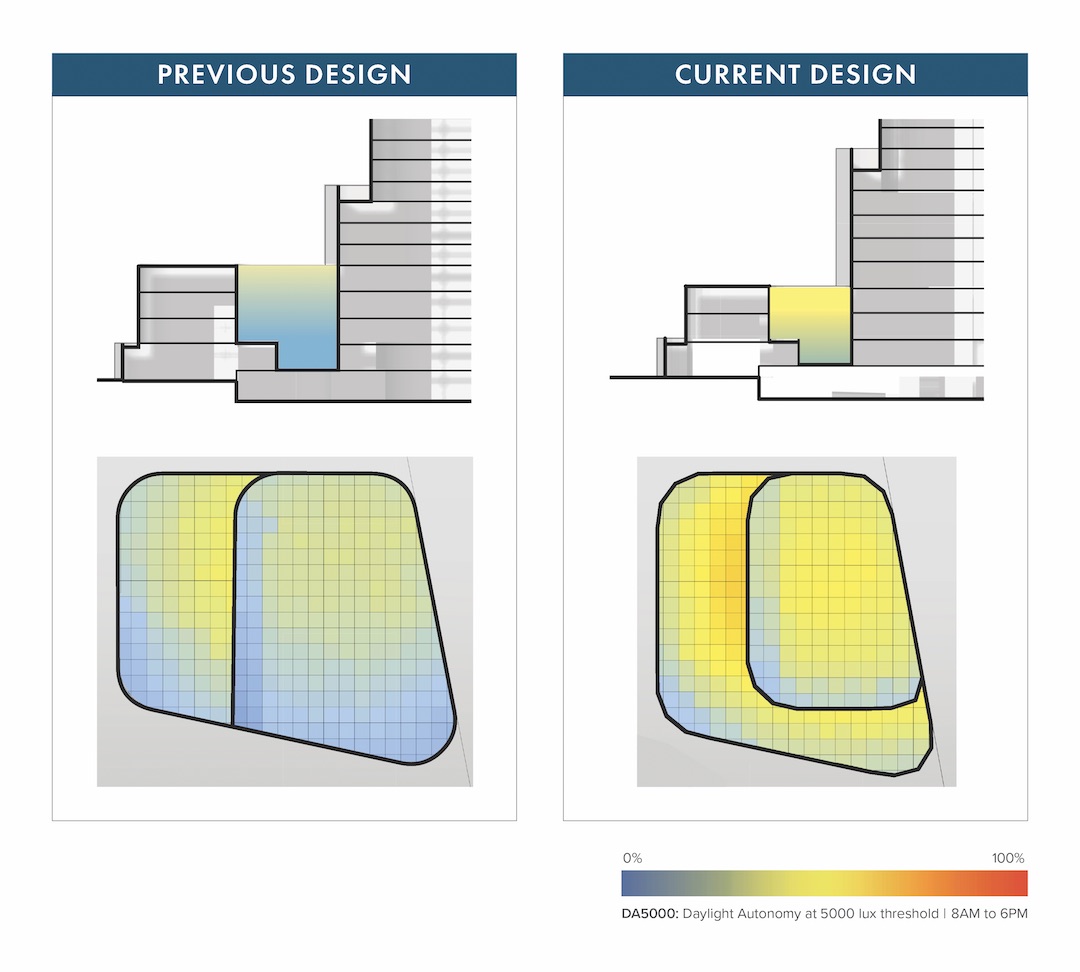 ZGF Architects has developed an urban daylighting tool that it first tried out on a high-rise building in British Columbia to position the building’s outdoor courtyard for optimum daylight exposure. The analytical tool told the design team that the courtyard needed to be shallower and terraced away from the sun to achieve that goal. Image: ZGF Architects.
AEC firms must also demonstrate the value of data to get clients to pay for it, says Herbert Els, Senior Vice President–Building Technology Systems with WSP USA in Boulder, Colo. That value is still sometimes a harder sell because of data’s “soft ROI,” says Envise’s Baldwin, who observes that data, at the moment, seems more relevant to developers and property managers of existing buildings than for new construction, “where we need to be.”
Separating wheat from chaff
Faced with a firehose of data from myriad sources at their disposal, AEC firms and their clients have become far more discerning about what they collect, use, and disseminate. Firms say they’re trying to avoid falling down a “rabbit hole” that either buries them in information overload or sends them off on wild goose chases. A good anchoring point, says Arup’s Kostura and Gensler’s Tyson, is to identify the problem first before thinking about how data might help to solve it.
There are three types of data relevant to construction, says Don Weinreich, FAIA, LEED AP, Management Partner with Ennead Architects: Static (such as a building’s dimensions), Active (such as tracking the performance of mechanical systems to measure efficiency), and Human-centric, which Weinreich is convinced is the industry’s new frontier: “We now have the ability to know where people are in a space, and to predict where they’ll be. This opens our understanding of how spaces are being used and how systems are deployed.”
The most important data for Clark Construction, says its Vice President Brian Krause, revolves around a project’s existing conditions, its costs, and the productivity of buildings. His firm’s goal is to marry this data “with our building expertise to provide actionable insights.” In that light, jobsite superintendents remain integral to the data collection and analysis processes. “We need them so we can write algorithms and for their field presence,” says Krause.
WSP is focused on analyzing building systems against each other to gauge performance, says Els. The firm has also installed IoT devices in its Boulder office, turning it into a “living lab” that, says Els, influences future design.
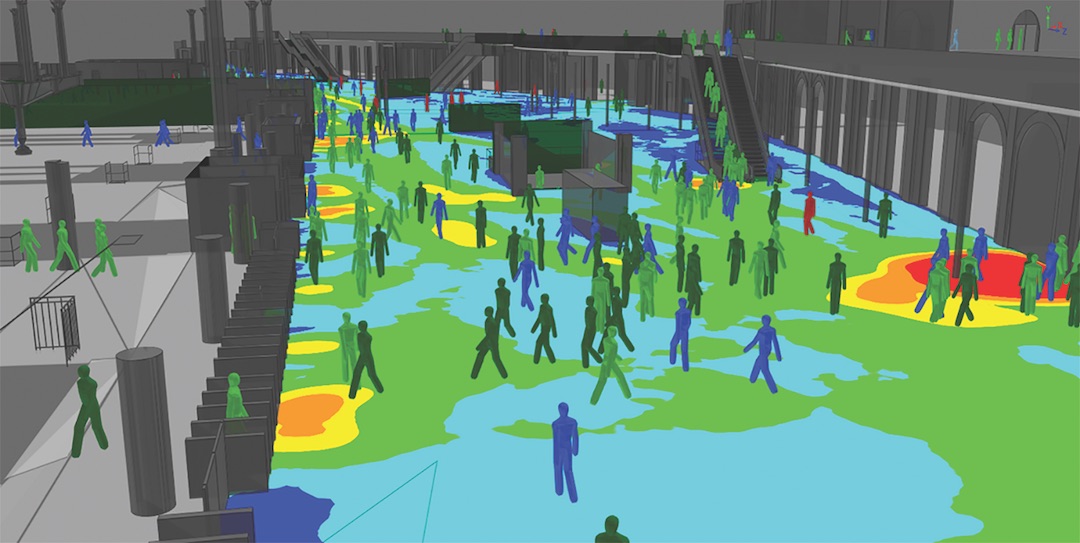 Arup has been developing an AI framework for its Mass Motion program that uses computer vision to gain insight into the way people move through spaces. Image: ARUP.
McCownGordon Construction in Kansas City, Mo., has been leveraging cloud-based platforms to collect data, and supplementing APIs with what Dustin Burns, the firm’s IT Director, calls “robotic process automation,” software that extracts information to generate reports in the form of Excel files to which new information can be merged.
“The practical application of data is in spotting leading indicators that could lead to change,” says Burns. Data analysis revealed that RFIs were typically being generated 40% to 60% into a project’s completion cycle. “We’re trying to push that back earlier” and get subcontractors involved before they’re on the jobsite, says Burns. “This is more of an inclusive decision-making process.”
SmithGroup, whose staff includes a data scientist and sociologist, uses a Revit data collector that takes into account 50 to 60 variables for each model. The data signifies how a model’s personality compares to the firm’s best practices for model integrity, explains Derek White, SmithGroup’s CIO. (An example of an “angry” model is one that might take much longer to open.)
DLR Group has formalized its platform for post-occupancy evaluation in order to “close the loop” between design, construction, and operations, says Ruairi Barnwell, Principal and Energy Services Leader. DLR Group’s ultimate goal is to create an evidence-based library for this practice that enables the firm to hit its carbon-neutral targets for 2030.
Where building data provided real-world insights
Among the AEC firms interviewed, their use of data breaks down into four buckets:
Operations. Baldwin says that Southland has overlaid an analytical platform onto the data being generated from the HVAC system within an embassy in Washington, D.C. “We’ve learned some things about temperature, comfort, and energy” that can be applied to “figuring out problems we knew we had.” Southland is also in the midst of building a military-base museum with 400 sensors installed which will produce data that, says Baldwin, could be used for future wayfinding and crowd control.
Data analysis has helped DLR Group spot where building systems’ economizers weren’t set properly, and where the on-off scheduling of systems running a building in Chicago weren’t working “and hadn’t been set right from the get-go,” says Barnwell.
ZGF last year launched an urban daylighting tool whose development began with a questionnaire designed to qualitatively analyze the human impact of natural light on 25 existing outdoor spaces—courtyards, alleys, streets—in six cities. Architect Elizabeth deRegt says 276 people were interviewed, and the findings allowed the firm to create a new set of metrics that it first applied to the design of a courtyard for a 25-story office tower in British Columbia. Originally the courtyard was to be on the ground floor, but ZGF’s analysis made clear it would need to be elevated one floor to increase its exposure to natural light. The redesigned courtyard—with one terrace that’s 144.9 sm and another that’s 138.2 sm—is less deep, and allows for placement of trees in optimal locations.
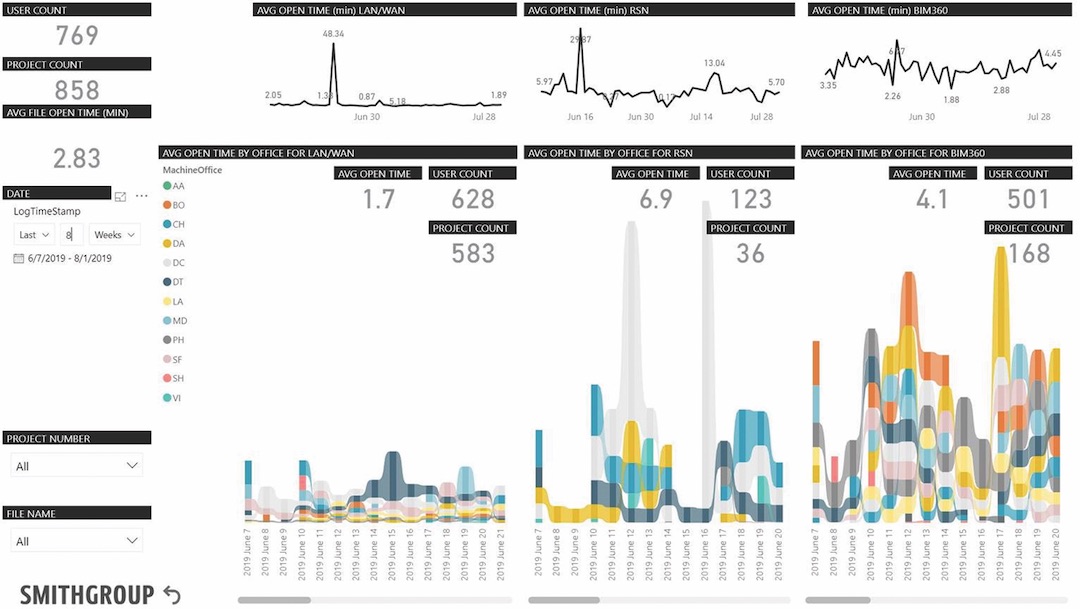 SmithGroup uses a Revit Data Collection tool that gauges the “personality” of models—such as how long they take to open—based on how they compare with the firm’s model integrity parameters. Image: SmithGroup.
Last March, at Turner Construction’s annual Innovation Summit, a team working on the massive Los Angeles Stadium and Entertainment District presented a new business intelligence (BI) dashboard for analyzing financial and engineering data. Laura Santo, Project Controls Manager at Turner’s Southern California office, calls this dashboard a “one-stop shop” that organizes data into digestible formats.
The reports produced by the dashboard provide “interactive visual tools,” complete with metrics and action items, says Santo. By using this dashboard, for example, Turner and Kroenke Group, the owner of the L.A. District project, were able to eliminate their weekly meeting about change orders. Turner is now rolling out the dashboard to other projects across the country.
Construction. At the beginning of each job, Clark identifies potential major risks and bases its data collection and analytical strategies around these to put together a digital management plan. Clark Construction won’t touch a site before it collects data on underground utility locations, soil, and other existing conditions. That information derives from the firm’s own laser scans, as well as other open sources, which Krause concedes “aren’t always the best” and might require Clark to do more test pits or excavation “to raise our confidence level.”
On one of its projects, Lendlease is using 3D cameras on the jobsite that have machine-learning capabilities that Benedict says have led to some tangible workplace improvements (which she wouldn’t elaborate on). Lendlease is also compiling data to develop a tool that identifies areas on jobsites that might be higher risk for fires.
People movement. FXCollaborative is redesigning a large lobby inside a building in New York City to reconfigure its traffic flow. That effort includes examining data from card readers used by employees and visitors, which told FXC what entrances and exits are frequented most. Alexandra Pollock, Principal, LEED AP BD+C, Director of Design Technology, says this data allowed her firm to conduct a pedestrian simulation analysis that will inform where it places the reception/information desk vis-a-vis the elevator banks to minimize the cross-flow of daily traffic.
Arup has a program called Mass Motion, which enables users to import a virtual building design, like a Revit model, and inject avatars to model human movement behavior. But the avatar behaviors are based on pedestrian movement guidelines published in the 1960s, which offer opportunities to improve precision by modeling detailed human characteristics such as individual speed and size. So Arup is developing an artificial intelligence framework that utilizes computer vision to gain insight into the way people move through specific spaces. Algorithms are outfitted on a Rasberry Pi processor located next to a camera, so people “counts” can be processed in real time without the need for video storage, which Kostura says is a “value add” from a privacy protection standpoint.
WSP is working with a large technology firm that has buildings all over the world to develop smart space utilization that can accommodate the company’s aggressive hiring. “It is asking how, if it hired 1,000 people, it could move people around,” explains Els. WSP designed a multisensory system on a high-resolution grid that Els says “pushes” data into an analytical environment. The client is now sharing this information with its real estate team.
 For its design of the Phil and Penny Knight Campus for Accelerating Scientific Impact at the University of Oregon, Ennead Architects deployed an analytical tool created by the engineering firm Buro Happold to create virtual models with avatars included to simulate trails of movement, with the intention of predicting where casual interactions within the building might occur. Image: Ennead Architects.
Ennead, with Bora Architects, designed the University of Oregon’s Phil and Penny Knight Campus for Accelerating Scientific Impact, which is under construction. Weinreich says that one of the goals of this campus is the bring together academia and business. So Ennead deployed a tool developed by Buro Happold that creates a virtual model of the space, and populates the model with avatars that behave according to certain rules and patterns to simulate trails of movement and to identify where casual interactions might happen. Ennead is now beta testing a more advanced tool that incorporates machine learning and sensors.
Workplace. Seattle Children’s Hospital has been relocating its administrative staff to three floors of a downtown high rise, about five miles from the hospital’s main campus. As a prelude, Seattle Children’s partnered with ZGF to assess how each of its departments uses space, and to project future capacity needs. ZGF surveyed the workers who would be moving, to gauge more precisely how they worked individually and with each other. Sara Howell and Amy Tricoli, ZGF’s Project Architect and Associate Urban Designer, say the surveys revealed, for instance, that two- to three-person meeting rooms were in greater demand than expected. “One of our goals was to right-size the ratio of different spaces,” says Howell.
SmithGroup’s Chicago office, with about 100 people on one floor, was its first to go completely agile. As the firm was fitting out the first three-quarters of that space, it tagged employees and used a Bluetooth beacon to monitor their movements. White says this data informed how the last quarter of the floor was fitted out, and showed a need for smaller conference rooms. (They also showed that people don’t move around that much.) SmithGroup has also created an app called Colleague Finder, which uses access points, like smartphones, to locate where people are in its offices. This was first tested at the firm’s Ann Arbor, Mich., office and is being rolled out to San Francisco (with 170 employees on several floors) and Detroit (300 people on three floors).
is data a reliable crystal ball?
The dream of many AEC firms is that data will be their ticket to predicting outcomes, which could, among other things, mitigate jobsite risk, improve occupant comfort and, on a broader scale, facilitate smarter cities.
To that end, Suffolk Construction is one of nine construction firms that are members of the Predictive Analytics Strategic Council, whose goal, says Chin, is to share and aggregate data for the purpose of developing predictive software that can be marketed to the industry. The impetus behind the council’s formation was a 12-month collaboration between Suffolk and Smartvid.io. Suffolk contributed a decade’s worth of photo and project data, which Smartvid.io (the council’s technical advisor) analyzed and then fed additional project data into a multilayered machine learning model to see if jobsite incidents could be forecast.
Chin and other AEC sources are convinced that, with enough data, reliable predictions are possible. “It’s a feasible aspiration,” says Clark Construction’s Krause. But, he cautions, the uncertain nature of construction will always need to be built into any model. That’s why he prefers prescriptive algorithms that leave wriggle room for improvisation when it comes to constructability, coding, and interoperability.
Nancy Reyes, HMC Architects’ Associate Principal and Corporate BIM Director, says her firm is actually less interested in predicting behaviors than in leveraging data “that will give us more options” to select from.
“I’m heartened that other firms aren’t being deterministic,” says Gensler’s Tyson. The building environment, he points out, remains “highly dynamic,” so what data provides “is an opportunity to learn and have information in real, or almost real, time.”
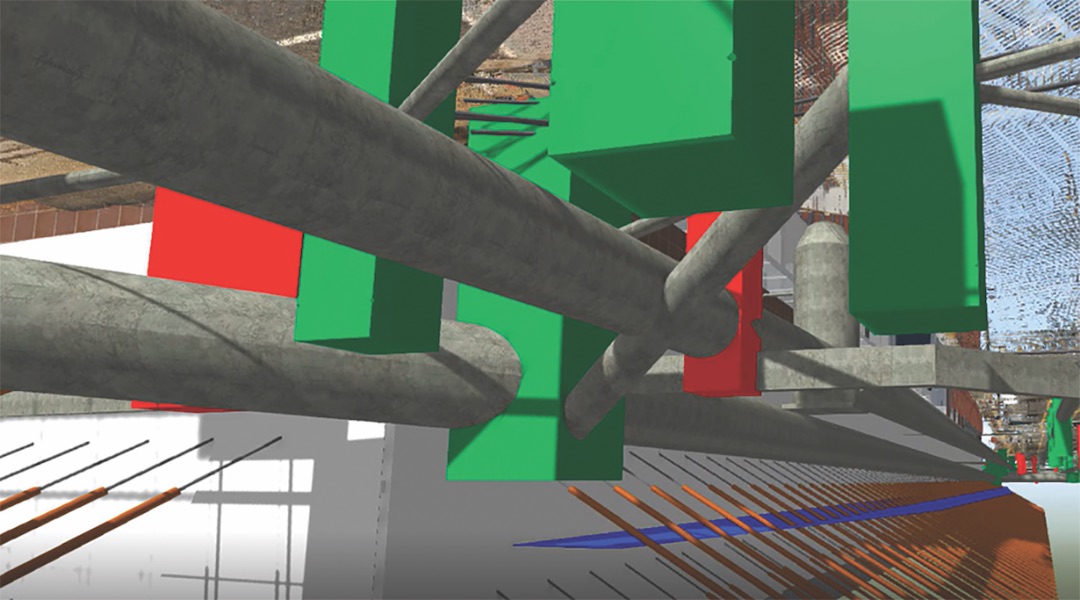 Before starting most projects, Clark Construction collects data on the location’s underground utilities. That investigation sometimes includes historical information, such as previous surveys, that is not always reliable or correct, which requires Clark to generate its own data about the site to assess risk. The image shown is from a laser scan. Image: Clark Construction.
From response to revenue
Right now, construction data analysis and application are part of what Jacobs’ McElvaney and other AEC experts view as a “convergence of technology” that is also spurring the rise of digital twin, machine learning, and AI.
But just how robustly can data be monetized, which some sources suggest is the industry’s logical next step, and what the Predictive Analytics Strategic Council is trying to achieve?
Arup’s Kostura sees opportunities in data for creating new services. He cites a large mixed-use project in the U.S. where Arup flowed the buildings’ communication data through a converged network in the cloud. He explains that putting data in a single space allows for the correlation of data sets, which is the basis for machine learning. Creating a serverless built environment, he adds, “enhances the building’s operations.”
Related Stories
Big Data | May 5, 2016
The Center for Neighborhood Technology has launched the largest source of transit data in the country
AllTransit analyzes the social benefits of good transit service by analyzing data related to health, equity, and economic development.
Big Data | May 5, 2016
Demand for data integration technologies for buildings is expected to soar over the next decade
A Navigant Research report takes a deeper dive to examine where demand will be strongest by region and building type.
Big Data | Apr 18, 2016
Chicago to install 500 sensors through its Array of Things data project
The devices will track traffic, light, air quality, and temperatures. The data will be made available to the public.
Big Data | Mar 28, 2016
Predictive analytics: How design firms can benefit from using data to find patterns, trends, and relationships
Branden Collingsworth, HDR’s new Director of Predictive Analytics, clarifies what his team does and how architecture projects can benefit from predictive analytics.


