Government work is scattered among dozens of federal civilian agencies, the Pentagon and the military branches, the 50 states, and tens of thousands of municipalities. The only thing these disparate entities have in common is a tight hold on their pocketbooks. With the federal stimulus having faded into the ether, and with state and municipal collections of sales and property taxes down, government construction at all levels will be slow to recover.“We’ll be lucky to see 2007 numbers by 2017,” says Margaret Bowker, Vice President, JE Dunn Construction.
Inside the Beltway, the GSA, the National Institutes of Health, the Naval Facilities Engineering Command, and the U.S. Army Corps of Engineers are still posting RFPs, but there’s a sense that “spending has been put on hold to wait and see the outcome of the election,” says Barry Perkins, LEED AP BD+C, Vice President – Government Construction, James G. Davis Construction Corp.“Certainly the size and type of projects has changed, with more smaller renovations and retrofits than larger new construction,” he says.
SCROLL DOWN FOR GIANTS 300 GOVERNMENT FIRM RANKINGS
“We’re showing up to prebids and competing against firms that never used to pursue city or county work,” says Dennis Thompson, Executive Vice President for Business Development, Manhattan Construction Co. “Competition has increased five- or six-fold, so you see an erosion of fees.”
The result: “You have the same firms chasing a smaller pool of projects,” says Len Vetrone, Webcor Builders’ Senior Vice President for Public and Federal Work.
MAKING THE ADJUSTMENT TO GOVERNMENT WORK
For newbies to federal work, learning how to work with the bureaucracy can be an eye-opener. When the economy went into the tank in 2008, Pepper Construction Group took on its first two GSA projects—the renovation of the Mies van der Rohe-designed John C. Kluczynski Federal Building, in Chicago, and the John Weld Peck Federal Building, in Cincinnati.
“There’s just an enormous amount of paperwork, forms, and protocols that are required on government jobs compared to our private work,” says Senior Vice President Rich Tilghman, PE. “We have high-quality teams with lots of experience renovating large buildings in the private sector, and GSA recognized that,” he says, adding that the $100 million in revenue for the two projects was certainly welcome.
Even firms with decades of federal civilian and military experience have to keep constantly attuned to client needs. Reynolds Smith & Hills has been designing and maintaining facilities for NASA for 50 years. Recently, the firm replaced almost 10,000 square feet of windows in the Launch Control Center at the Kennedy Space Center, a highly sensitive project. “NASA is a wonderful client, always looking for innovative solutions, but you have to create a low-risk environment for them,” says RS&H Vice President Richard Hammett, AIA, LEED AP.
Public-private partnerships are “starting to catch on” at the state and local level, says Webcor Builders’ Vetrone. “We’re talking to some of the cities we work for in California which have major public projects with no funding, looking at how P3 could make those a reality,” he says. A recently awarded P3 for a courthouse in Long Beach has attracted a lot of interest from the local AEC community, he says.
Manhattan Construction’s Thompson says privatization seems to be gaining traction with some federal clients. His firm is serving as contracting partner in such a developer leaseback scheme for a VA clinic in Grand Rapids, Mich., with U.S. Federal Properties.
SOME BRIGHT SPOTS ON THE HORIZON
Even with budget cuts, there will still be public-sector jobs for AEC firms. For example, Webcor Builders’ Vetrone reports “a fair amount” of aviation projects in California. “The big work at LAX and Sacramento has been awarded, but SFO still has a fairly aggressive program,” he says.
Manhattan Construction’s Thompson says some state and local government agencies may be rethinking their procurement policies because “service and delivery quality have been affected” by their reliance on super-low bidders. “The trend is back to technical qualifications plus low price, but at least it’s not just low price,” he says.
Vetrone says Webcor Builders is being “pretty selective” as to which government projects it bids on. “We’re looking for clients who want to hire on a best-value basis, whether design-build or CM at risk, where your qualifications, technical competence, and people count as much as your price,” he says.
More commissioning of government and military buildings could also be a godsend for AEC firms. “We’ve done enhanced commissioning for the Air Force, and we’re finding that the buildings have a marked increase in performance,” says RS&H’s Hammett. “If anything was a no-brainer, commissioning would be it.”
Portfolio optimization is becoming much more important to governments at all levels, as they seek to reduce overhead while improving employee productivity. “They’re looking for a trifecta—asset preservation, sustainability, and innovative workplace solutions,” says Becky Greco, Principal, HGA Architects and Engineers. Public-sector clients want to emulate the corporate model of “better, faster, more cost-efficient,” she says.
Lisa Bottom, a Principal at Gensler, agrees. “Government workplaces are moving away from a hierarchical structure and embracing an open plan” based on actual space usage and employee mobility patterns, she says. The goal: flexible offices that will meet current and future needs of the workforce at all levels of government. +
TOP 25 GOVERNMENT SECTOR ARCHITECTURE FIRMS
| Rank | Company | 2011 Government Revenue ($) |
| 1 | HOK | 143,334,571 |
| 2 | Heery International | 103,832,000 |
| 3 | SmithGroupJJR | 77,652,837 |
| 4 | IBI Group | 57,347,163 |
| 5 | Perkins+Will | 48,059,661 |
| 6 | HDR Architecture | 46,000,000 |
| 7 | EYP Architecture & Engineering | 40,892,580 |
| 8 | Skidmore, Owings & Merrill | 33,907,000 |
| 9 | HNTB Architecture | 31,338,712 |
| 10 | PageSoutherlandPage | 27,263,377 |
| 11 | NBBJ | 24,958,000 |
| 12 | LEO A DALY | 24,141,694 |
| 13 | Hammel, Green and Abrahamson | 24,028,000 |
| 14 | PGAL | 24,018,100 |
| 15 | Reynolds, Smith and Hills | 18,900,000 |
| 16 | ZGF Architects | 17,653,791 |
| 17 | RTKL Associates | 17,075,180 |
| 18 | DLR Group | 17,000,000 |
| 19 | Gensler | 17,000,000 |
| 20 | Moseley Architects | 13,700,000 |
| 21 | Beyer Blinder Belle Architects & Planners | 12,450,000 |
| 22 | Sasaki Associates | 12,356,441 |
| 23 | Cannon Design | 12,000,000 |
| 24 | KMD Architects | 11,913,372 |
| 25 | Fentress Architects | 11,830,262 |
TOP 25 GOVERNMENT SECTOR ENGINEERING FIRMS
| Rank | Company | 2011 Government Revenue ($) |
| 1 | AECOM Technology Corp. | 2,485,000,000 |
| 2 | Fluor Corp. | 1,127,862,000 |
| 3 | Jacobs | 924,100,000 |
| 4 | URS Corp. | 309,987,000 |
| 5 | STV | 133,396,000 |
| 6 | Stantec | 117,000,000 |
| 7 | Dewberry | 57,006,253 |
| 8 | Atkins North America | 43,330,846 |
| 9 | Parsons Brinckerhoff | 35,515,523 |
| 10 | H&A Architects & Engineers | 31,641,856 |
| 11 | Michael Baker Jr., Inc. | 30,830,000 |
| 12 | Science Applications International Corp. | 15,431,116 |
| 13 | Walter P Moore | 12,531,123 |
| 14 | Coffman Engineers | 12,400,000 |
| 15 | SSOE Group | 12,321,198 |
| 16 | WSP USA | 10,900,000 |
| 17 | Arup | 10,580,870 |
| 18 | TLC Engineering for Architecture | 8,528,328 |
| 19 | Sebesta Blomberg | 8,450,225 |
| 20 | Interface Engineering | 8,103,067 |
| 21 | Walker Parking Consultants | 7,887,763 |
| 22 | Simpson Gumpertz & Heger | 7,800,000 |
| 23 | KPFF Consulting Engineers | 7,000,000 |
| 24 | RMF Engineering | 7,000,000 |
| 25 | Wiss, Janney, Elstner Associates | 6,936,000 |
TOP 25 GOVERNMENT SECTOR CONSTRUCTION FIRMS
| Rank | Company | 2011 Government Revenue ($) |
| 1 | Turner Corporation, The | 2,268,320,925 |
| 2 | Jacobs | 924,100,000 |
| 3 | Clark Group | 850,491,577 |
| 4 | Whiting-Turner Contracting Co., The | 749,080,537 |
| 5 | Gilbane Building Co. | 736,199,000 |
| 6 | Hensel Phelps Construction | 669,080,000 |
| 7 | Walsh Group, The | 552,751,904 |
| 8 | Skanska USA | 550,758,448 |
| 9 | Webcor Builders | 484,567,966 |
| 10 | Tutor Perini | 385,311,000 |
| 11 | Balfour Beatty US | 341,774,742 |
| 12 | URS Corp. | 309,987,000 |
| 13 | Manhattan Construction Group | 274,683,334 |
| 14 | Alberici Corp. | 247,423,509 |
| 15 | PCL Construction Enterprises | 245,007,223 |
| 16 | Mortenson | 233,863,000 |
| 17 | Flintco | 223,200,000 |
| 18 | McCarthy Holdings | 218,000,000 |
| 19 | James G. Davis Construction | 208,000,000 |
| 20 | Yates Companies, The | 187,800,000 |
| 21 | Ryan Companies US | 156,858,437 |
| 22 | DPR Construction | 146,889,203 |
| 23 | JE Dunn Construction | 135,637,557 |
| 24 | Sundt Construction | 100,393,850 |
| 25 | CORE Construction | 94,340,532 |
Related Stories
Cultural Facilities | Nov 21, 2023
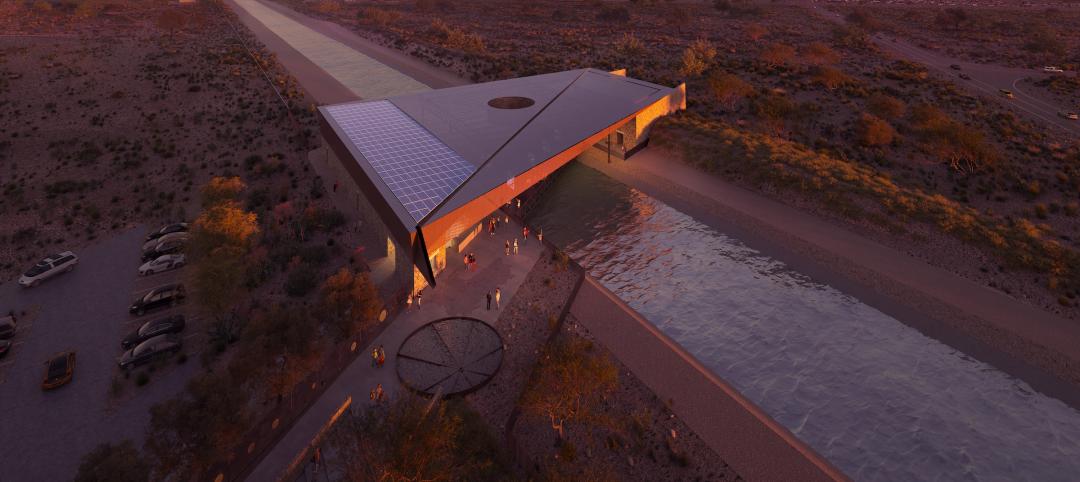
Arizona’s Water Education Center will teach visitors about water conservation and reuse strategies
Phoenix-based architecture firm Jones Studio will design the Water Education Center for Central Arizona Project (CAP)—a 336-mile aqueduct system that delivers Colorado River water to almost 6 million people, more than 80% of the state’s population. The Center will allow the public to explore CAP’s history, operations, and impact on Arizona.
MFPRO+ New Projects | Nov 21, 2023
An 'eco-obsessed' multifamily housing project takes advantage of downtown Austin’s small lots
In downtown Austin, Tex., architecture firm McKinney York says it built Capitol Quarters to be “eco-obsessed, not just eco-minded.” With airtight walls, better insulation, and super-efficient VRF (variable refrigerant flow) systems, Capitol Quarters uses 30% less energy than other living spaces in Austin, according to a statement from McKinney York.
MFPRO+ News | Nov 21, 2023
California building electrification laws could prompt more evictions and rent increases
California laws requiring apartment owners to ditch appliances that use fossil fuels could prompt more evictions and rent increases in the state, according to a report from the nonprofit Strategic Actions for a Just Economy. The law could spur more evictions if landlords undertake major renovations to comply with the electrification rule.
Codes and Standards | Nov 21, 2023
Austin becomes largest U.S. city to waive minimum parking requirements
Austin, Texas recently became the largest city in the United States to stop requiring new developments to set a minimum amount of parking. The Austin City Council voted 8-2 earlier this month to eliminate parking requirements in an effort to fight climate change and spur more housing construction as Texas’s capitol grapples with a housing affordability crisis.
MFPRO+ News | Nov 21, 2023
Underused strip malls offer great potential for conversions to residential use
Replacing moribund strip malls with multifamily housing could make a notable dent in the housing shortage and revitalize under-used properties across the country, according to a report from housing nonprofit Enterprise Community Partners.
Giants 400 | Nov 16, 2023
Top 100 Science + Technology Facility Architecture Firms for 2023
Gensler, HDR, Page Southerland Page, Flad Architects, and DGA top BD+C's ranking of the nation's largest science and technology (S+T) facility architecture and architecture/engineering (AE) firms for 2023, as reported in Building Design+Construction's 2023 Giants 400 Report. Note: This ranking factors revenue from all science and technology (S+T) buildings work, including laboratories, research buildings, technology/innovation buildings, pharmaceutical production facilities, and semiconductor production facilities.
Resiliency | Nov 16, 2023
How inclusive design supports resilience and climate preparedness
Gail Napell, AIA, LEED AP BD+C, shares five tips and examples of inclusive design across a variety of building sectors.
Retail Centers | Nov 15, 2023
Should retail developers avoid high crime areas?
For retailers resolute to operating in high crime areas, design elements exist to mitigate losses and potentially deter criminal behavior.
MFPRO+ News | Nov 15, 2023
Average U.S multifamily rents drop $3 to $1,718 in October 2023: Yardi Matrix
Multifamily fundamentals continued to soften and impact rents last month, according to the latest Yardi Matrix National Multifamily Report. The average U.S. asking rent dropped $3 to $1,718 in October, with year-over-year growth moderating to 0.4%, down 40 basis points from September. Occupancy slid to 94.9%, marking the first decline in four months.
MFPRO+ Special Reports | Nov 14, 2023
Register today! Key trends in the multifamily housing market for 2024 - BD+C Live Webinar
Join the BD+C and Multifamily Pro+ editorial team for this live webinar on key trends and innovations in the $110 billion U.S. multifamily housing market. A trio of multifamily design and construction experts will present their latest projects, trends, innovations, and data/research on the three primary multifamily sub-sectors: rental housing, senior living, and student housing.


