


With increasing demand for design services, the Architecture Billings Index (ABI) is continuing to strengthen. As a leading economic indicator of construction activity, the ABI reflects the approximate nine to twelve month lag time between architecture billings and construction spending.
The American Institute of Architects reported the February ABI score was 54.9, up slightly from a mark of 54.2 in January. This score reflects a strong increase in demand for design services (any score above 50 indicates an increase in billings). The new projects inquiry index was 64.8, higher than the reading of 63.2 the previous month – and its highest mark since January 2007.
“Conditions have been strengthening in all regions and construction sectors for the last several months,” said AIA Chief Economist, Kermit Baker, PhD, Hon. AIA. “Still, we also continue to hear a mix of business conditions in the marketplace as this hesitant recovery continues to unfold.”
Key February ABI highlights:
- Regional averages: Northeast (56.7), Midwest (54.7), West (54.7), South (52.7)
- Sector index breakdown: multi-family residential (60.9), mixed practice (56.9), commercial / industrial (53.3), institutional (50.7)
- Project inquiries index: 64.8.
- The regional and sector categories are calculated as a 3-month moving average, whereas the index and inquiries are monthly numbers.
About the AIA Architecture Billings Index
The Architecture Billings Index (ABI), produced by the AIA Economics & Market Research Group, is a leading economic indicator that provides an approximately nine to twelve month glimpse into the future of nonresidential construction spending activity. The diffusion indexes contained in the full report are derived from a monthly “Work-on-the-Boards” survey that is sent to a panel of AIA member-owned firms. Participants are asked whether their billings increased, decreased, or stayed the same in the month that just ended as compared to the prior month, and the results are then compiled into the ABI. These monthly results are also seasonally adjusted to allow for comparison to prior months. The monthly ABI index scores are centered around 50, with scores above 50 indicating an aggregate increase in billings, and scores below 50 indicating a decline. The regional and sector data are formulated using a three-month moving average. More information on the ABI and the analysis of its relationship to construction activity can be found in the White Paper Architecture Billings as a Leading Indicator of Construction: Analysis of the Relationship Between a Billings Index and Construction Spending on the AIA web site.
About The American Institute of Architects
Founded in 1857, members of the American Institute of Architects consistently work to create more valuable, healthy, secure, and sustainable buildings, neighborhoods, and communities. Through nearly 300 state and local chapters, the AIA advocates for public policies that promote economic vitality and public well being. Members adhere to a code of ethics and conduct to ensure the highest professional standards. The AIA provides members with tools and resources to assist them in their careers and business as well as engaging civic and government leaders, and the public to find solutions to pressing issues facing our communities, institutions, nation and world. Visit www.aia.org.
Related Stories

| Nov 11, 2013
4 trends driving the recovering commercial construction sector
Jones Lang LaSalle research reveals a four-point “new look” for the post-recession construction industry.

| Nov 8, 2013
Oversized healthcare: How did we get here and how do we right-size?
Healthcare facilities, especially our nation's hospitals, have steadily become larger over the past couple of decades. The growth has occurred despite stabilization, and in some markets, a decline in inpatient utilization.

| Nov 8, 2013
Can Big Data help building owners slash op-ex budgets?
Real estate services giant Jones Lang LaSalle set out to answer these questions when it partnered with Pacific Controls to develop IntelliCommand, a 24/7 real-time remote monitoring and control service for its commercial real estate owner clients.

| Nov 8, 2013
S+T buildings embrace 'no excuses' approach to green labs
Some science-design experts once believed high levels of sustainability would be possible only for low-intensity labs in temperate zones. But recent projects prove otherwise.

| Nov 8, 2013
Net-zero bellwether demonstrates extreme green, multifamily style
The 10-unit zHome in Issaquah Highlands, Wash., is the nation’s first net-zero multifamily project, as certified this year by the International Living Future Institute.
| Nov 8, 2013
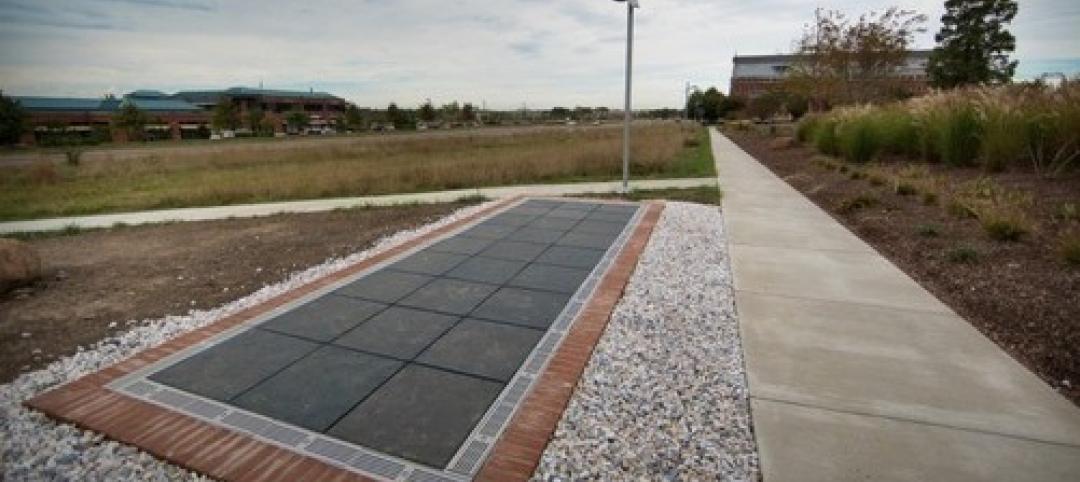
Walkable solar pavement debuts at George Washington University
George Washington University worked with supplier Onyx Solar to design and install 100 sf of walkable solar pavement at its Virginia Science and Technology Campus in Ashburn, Va.

| Nov 6, 2013
PECI tests New Buildings Institute’s plug load energy use metrics at HQ
Earlier this year, PECI used the NBI metrics to assess plug load energy use at PECI headquarters in downtown Portland, Ore. The study, which informed an energy-saving campaign, resulted in an 18 percent kWh reduction of PECI’s plug load.
 Elementary School is among a number of net-zero-ready schools planned in the Lone Star State. Energy-ef")
| Nov 5, 2013
Net-zero movement gaining traction in U.S. schools market
As more net-zero energy schools come online, school officials are asking: Is NZE a more logical approach for school districts than holistic green buildings?

| Nov 5, 2013
New IECC provision tightens historic building exemption
The International Energy Conservation Code has been revised to eliminate what has been seen as a blanket exemption for historic buildings.

| Nov 5, 2013
Living Building Challenge clarifies net-zero definitions and standards
The Living Building Challenge has released the Net Zero Energy Building Certification to provide clearer definitions regarding what net zero really means and how it is to be achieved.


