After its first negative score in 10 months, the Architecture Billings Index (ABI) showed a nominal increase in design activity in February, and has been positive ten out of the past twelve months.
The American Institute of Architects (AIA) reported the February ABI score was 50.4, up slightly from a mark of 49.9 in January. This score reflects a minor increase in design services (any score above 50 indicates an increase in billings).
The new projects inquiry index was 56.6, down from a reading of 58.7 the previous month.
As a leading economic indicator of construction activity, the ABI reflects the approximate nine to twelve month lead time between architecture billings and construction spending.
“The health of the institutional market has been the key factor for positive business conditions for the design and construction industry in recent months, and it is encouraging to see that sector remain on solid footing,” said AIA Chief Economist Kermit Baker, Hon. AIA, PhD. “However, we’re seeing some slowing in the other major construction sectors. Design billings for residential projects had its first negative month in over three years, and commercial design billings have seen only modest growth in recent years.”
Key February ABI highlights:
- Regional averages: South (52.5), Midwest (50.2), Northeast (48.0), West (46.7)
- Sector index breakdown: institutional (52.2), commercial / industrial (51.4), multi-family residential (48.9), mixed practice (45.3)
- Project inquiries index: 56.6
- Design contracts index: 50.0
The regional and sector categories are calculated as a 3-month moving average, whereas the national index, design contracts and inquiries are monthly numbers.
About the AIA Architecture Billings Index
The Architecture Billings Index (ABI), produced by the AIA Economics & Market Research Group, is a leading economic indicator that provides an approximately nine to twelve month glimpse into the future of nonresidential construction spending activity. The diffusion indexes contained in the full report are derived from a monthly “Work-on-the-Boards” survey that is sent to a panel of AIA member-owned firms. Participants are asked whether their billings increased, decreased, or stayed the same in the month that just ended as compared to the prior month, and the results are then compiled into the ABI. These monthly results are also seasonally adjusted to allow for comparison to prior months. The monthly ABI index scores are centered around 50, with scores above 50 indicating an aggregate increase in billings, and scores below 50 indicating a decline. The regional and sector data are formulated using a three-month moving average. More information on the ABI and the analysis of its relationship to construction activity can be found in the recently released White Paper, Designing the Construction Future: Reviewing the Performance and Extending the Applications of the AIA’s Architecture Billings Index on the AIA web site.
Related Stories
Healthcare Facilities | Jun 20, 2022
Is telehealth finally mainstream?
After more than a century of development, telehealth has become a standard alternative for many types of care.
Building Team | Jun 20, 2022
Andres Caballero Appointed President of Uponor North America
Uponor Corporation (Uponor) has named Andres Caballero president of its Building Solutions – North America division and a member of the Executive Committee at Uponor.
| Jun 20, 2022
An architectural view of school safety and security
With threats ranging from severe weather to active shooters, school leaders, designers, and security consultants face many challenges in creating safe environments that allow children to thrive.
School Construction | Jun 20, 2022
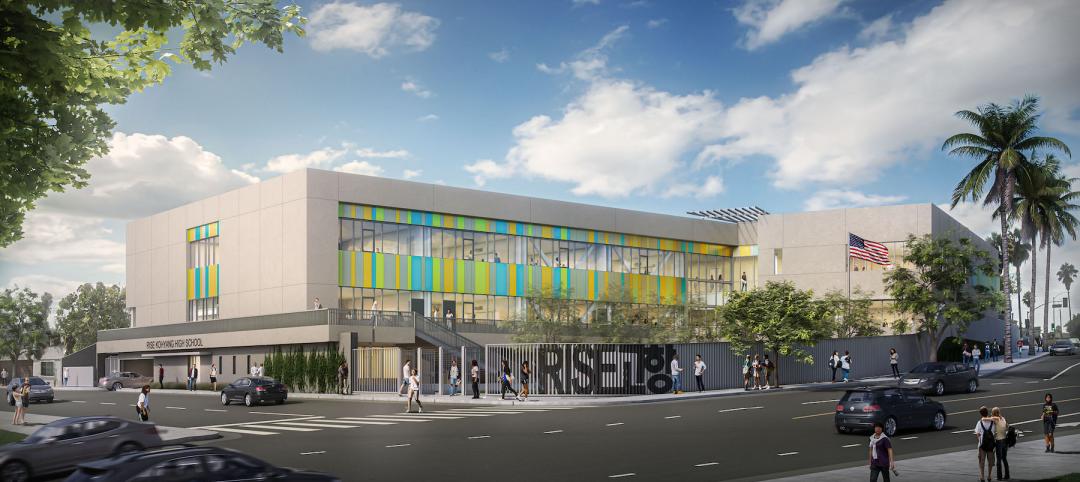
A charter high school breaks ground in L.A.’s Koreatown
A new charter school has broken ground in Los Angeles’ Koreatown neighborhood.
Building Team | Jun 17, 2022
Data analytics in design and construction: from confusion to clarity and the data-driven future
Data helps virtual design and construction (VDC) teams predict project risks and navigate change, which is especially vital in today’s fluctuating construction environment.
Sports and Recreational Facilities | Jun 17, 2022
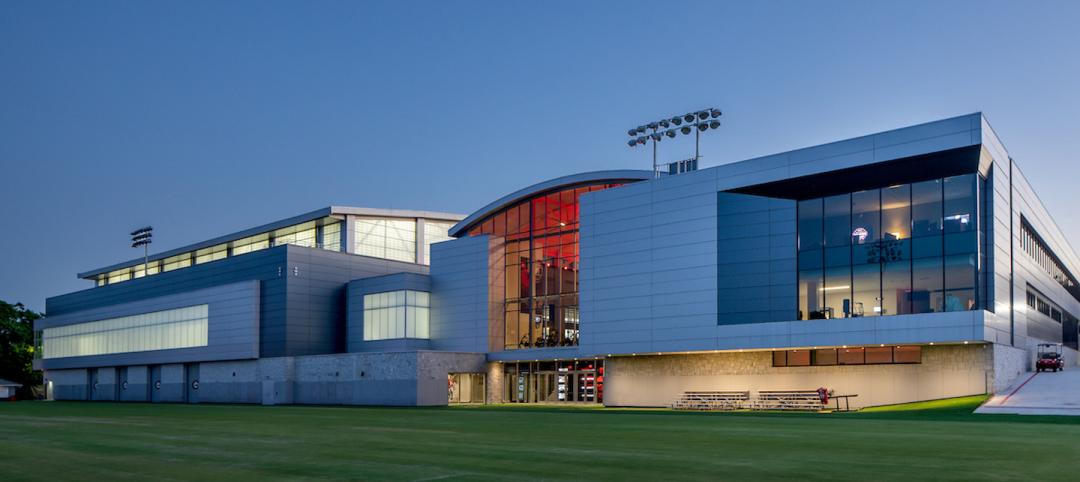
U. of Georgia football facility expansion provides three floors for high-performance training
A major expansion of the University of Georgia’s football training facility has been completed.
Building Team | Jun 16, 2022
Hybrid work expected to reduce office demand by 9%
Businesses are slowly but consistently transitioning to a permanent hybrid work environment, according to a senior economist at Econometric Advisors.
Building Team | Jun 16, 2022
USGBC announces more than 23 million square feet of LEED certified net zero space
Today, the U.S. Green Building Council announced nearly 100 net zero certifications earned under the LEED Zero program, representing more than 23 million square feet of space.
AEC Business Innovation | Jun 15, 2022
Cognitive health takes center stage in the AEC industry
Two prominent architecture firms are looking to build on the industry’s knowledge base on design’s impact on building occupant health and performance with new research efforts.
Market Data | Jun 15, 2022
ABC’s construction backlog rises in May; contractor confidence falters
Associated Builders and Contractors reports today that its Construction Backlog Indicator increased to nine months in May from 8.8 months in April, according to an ABC member survey conducted May 17 to June 3. The reading is up one month from May 2021.


