


As the prognosis for the design and construction industry continues to improve, the Architecture Billings Index (ABI) is reflecting its strongest growth since November 2007. As a leading economic indicator of construction activity, the ABI reflects the approximate nine to twelve month lag time between architecture billings and construction spending.
The American Institute of Architects (AIA) reported the January ABI score was 54.2, up sharply from a mark of 51.2* in December. This score reflects a strong increase in demand for design services (any score above 50 indicates an increase in billings). The new projects inquiry index was 63.2, much higher than the reading of 57.9 the previous month.
“We have been pointing in this direction for the last several months, but this is the strongest indication that there will be an upturn in construction activity in the coming months,” said AIA Chief Economist, Kermit Baker, PhD, Hon. AIA. “But as we continue to hear about overall improving economic conditions and that there are more inquiries for new design projects in the marketplace, a continued reservation by lending institutions to supply financing for construction projects is preventing a more widespread recovery in the industry.”
Key January ABI highlights:
- Regional averages: Midwest (54.4), West (53.4), South (51.7), Northeast (50.3)
- Sector index breakdown: mixed practice (54.9), multi-family residential (54.5), commercial / industrial (52.0), institutional (50.2)
- Project inquiries index: 63.2
The regional and sector categories are calculated as a 3-month moving average, whereas the index and inquiries are monthly numbers.
About the AIA Architecture Billings Index
The Architecture Billings Index (ABI), produced by the AIA Economics & Market Research Group, is a leading economic indicator that provides an approximately nine to twelve month glimpse into the future of nonresidential construction spending activity. The diffusion indexes contained in the full report are derived from a monthly “Work-on-the-Boards” survey that is sent to a panel of AIA member-owned firms. Participants are asked whether their billings increased, decreased, or stayed the same in the month that just ended as compared to the prior month, and the results are then compiled into the ABI. These monthly results are also seasonally adjusted to allow for comparison to prior months. The monthly ABI index scores are centered around 50, with scores above 50 indicating an aggregate increase in billings, and scores below 50 indicating a decline. The regional and sector data are formulated using a three-month moving average. More information on the ABI and the analysis of its relationship to construction activity can be found in the White Paper Architecture Billings as a Leading Indicator of Construction: Analysis of the Relationship Between a Billings Index and Construction Spending on the AIA web site.
About The American Institute of Architects
Founded in 1857, members of the American Institute of Architects consistently work to create more valuable, healthy, secure, and sustainable buildings, neighborhoods, and communities. Through nearly 300 state and local chapters, the AIA advocates for public policies that promote economic vitality and public well being. Members adhere to a code of ethics and conduct to ensure the highest professional standards. The AIA provides members with tools and resources to assist them in their careers and business as well as engaging civic and government leaders, and the public to find solutions to pressing issues facing our communities, institutions, nation and world. Visit www.aia.org.
* Every January the AIA research department updates the seasonal factors used to calculate the ABI, resulting in a revision of recent ABI values.
Related Stories

40 Under 40 | Sep 21, 2017
Meet the 40 Under 40 Class of 2017
These AEC stars are making their mark in business, philanthropy, and in their communities.

Office Buildings | Sep 20, 2017
Five Stantec offices move into one Fifth Avenue location
The new location provides the firm with 40,000 sf of space.

Architects | Sep 19, 2017
What we talk about when we talk about placemaking
What does Good Growth mean and how do we set about achieving it?
Architects | Sep 13, 2017
Leo A Daly hires hospitality-design veteran to lead its Dallas office
Ken Martin views this sector as an incubator of innovation.
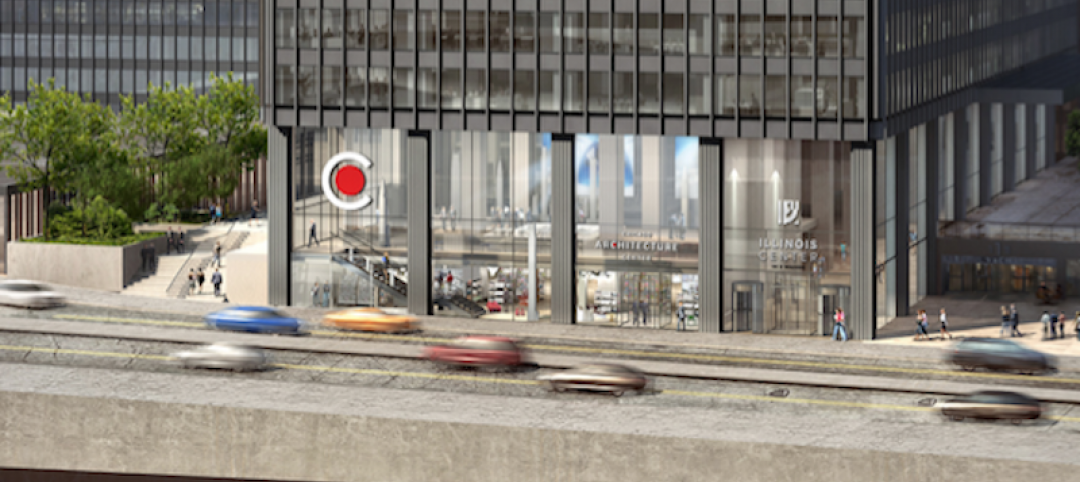
Museums | Sep 8, 2017
CAF announces plans for 20,000-sf Chicago Architecture Center to be built on East Wacker Drive
The Adrian Smith + Gordon Gill-designed space will open in summer 2018.

Architects | Sep 6, 2017
Fake architect caught in ‘Operation Vandelay Industries’ sentenced to 2 1/3 to 7 years in prison
The fake architect must also pay a $115,000 restitution.
Architects | Sep 6, 2017
Top 110 university architecture firms
Perkins+Will, Gensler, and CannonDesign top BD+C’s ranking of the nation’s largest university sector architecture and AE firms, as reported in the 2017 Giants 300 Report.

Contractors | Sep 6, 2017
Following the money: G702 progress payment certifications
There is no single method of calculating progress payments, but the most common formula is the percentage of completion applied to the total contract price, less a retainage which is held by the owner until final acceptance of the project.

Multifamily Housing | Sep 5, 2017
Free WiFi, meeting rooms most popular business services amenities in multifamily developments
Complimentary, building-wide WiFi is more or less a given for marketing purposes in the multifamily arena.

Architects | Sep 1, 2017
5 reasons why AEC firms need to focus on employer branding
Not to be confused with the branding of your firm overall, your employer brand is defined by your reputation as a workplace.


