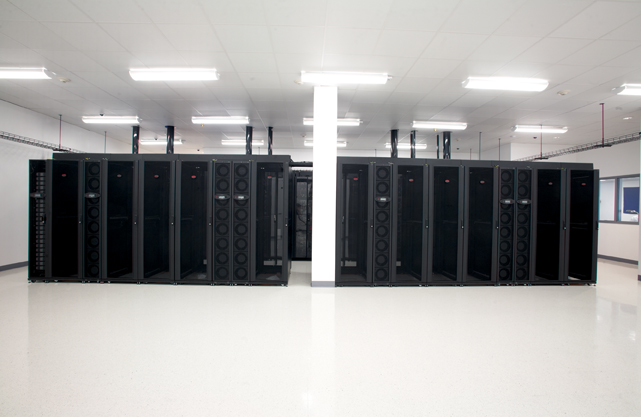
Demand for data centers is “exploding,” says Raj Gupta, PE, LEED AP, CEO of Environmental Systems Design and emeritus member of BD+C’s Editorial Board. According to Gartner Inc., in 2010, 2% of data centers contained 52% of total data center floor space and accounted for 63% of data center hardware spending.
In 2015, 2% of data centers will contain 60% of data center floor space and account for 71% of data center hardware spending.
“Traditional in-house enterprise data centers are under attack,” says Jon Hardcastle, Gartner’s research director. Virtualization technologies are helping companies to utilize their infrastructure more effectively, and data centers are getting more efficient. The move to consolidated third-party data centers is trimming the total number of midsize facilities, while large data centers are benefitting from the rise of cloud computing. +
TOP 25 DATA CENTER SECTOR ARCHITECTURE FIRMS
| Rank | Company | 2011 Data Center Revenue ($) |
| 1 | Corgan Associates | 22,854,000 |
| 2 | Gensler | 20,100,000 |
| 3 | HDR Architecture | 16,000,000 |
| 4 | LEO A DALY | 14,753,871 |
| 5 | PageSoutherlandPage | 12,890,000 |
| 6 | Integrated Design Group | 11,436,000 |
| 7 | Reynolds, Smith and Hills | 4,200,000 |
| 8 | RTKL Associates | 3,840,295 |
| 9 | CTA Architects Engineers | 3,787,800 |
| 10 | EwingCole | 3,000,000 |
| 11 | SMMA|Symmes Maini & McKee Associates | 2,123,426 |
| 12 | HLW International | 1,900,000 |
| 13 | Fentress Architects | 1,456,103 |
| 14 | Kirksey Architecture | 1,379,269 |
| 15 | PGAL | 1,096,000 |
| 16 | Heery International | 808,000 |
| 17 | Fishbeck, Thompson, Carr & Huber | 600,000 |
| 18 | Harley Ellis Devereaux | 600,000 |
| 19 | IBI Group | 563,474 |
| 20 | H+L Architecture | 537,059 |
| 21 | Ware Malcomb | 515,000 |
| 22 | Solomon Cordwell Buenz | 500,000 |
| 23 | HOK | 426,798 |
| 24 | Rule Joy Trammell + Rubio | 350,000 |
| 25 | Gresham, Smith and Partners | 234,347 |
TOP 25 DATA CENTER SECTOR ENGINEERING FIRMS
| Rank | Company | 2011 Data Center Revenue ($) |
| 1 | Fluor Corp. | 212,484,600 |
| 2 | Jacobs | 119,930,000 |
| 3 | Syska Hennessy Group | 43,577,806 |
| 4 | URS Corp. | 34,475,000 |
| 5 | Merrick & Co. | 31,500,000 |
| 6 | AKF Group | 10,500,000 |
| 7 | Atkins North America | 10,035,923 |
| 8 | Parsons Brinckerhoff | 7,400,000 |
| 9 | Eaton Energy Solutions | 6,169,598 |
| 10 | KPFF Consulting Engineers | 5,000,000 |
| 11 | H.F. Lenz Co. | 4,741,000 |
| 12 | Burns & McDonnell | 4,500,000 |
| 13 | Stantec | 4,230,000 |
| 14 | Glumac | 4,196,563 |
| 15 | Science Applications International Corp. | 3,950,000 |
| 16 | Zak Companies | 3,043,228 |
| 17 | Michael Baker Jr., Inc | 2,970,000 |
| 18 | R.G. Vanderweil Engineers | 2,830,900 |
| 19 | RMF Engineering | 2,500,000 |
| 20 | ESD|Environmental Systems Design | 2,450,000 |
| 21 | H&A Architects & Engineers | 2,300,000 |
| 22 | RDK Engineers | 2,245,000 |
| 23 | Guernsey | 2,041,552 |
| 24 | Middough | 1,750,000 |
| 25 | M+W U.S. | 1,654,867 |
TOP 25 DATA CENTER SECTOR CONSTRUCTION FIRMS
| Rank | Company | 2011 Data Center Revenue ($) |
| 1 | Holder Construction | 1,293,000,000 |
| 2 | DPR Construction | 666,292,020 |
| 3 | Turner Corporation, The | 434,435,518 |
| 4 | Whiting-Turner Contracting, The | 393,539,085 |
| 5 | Skanska USA | 369,889,632 |
| 6 | Mortenson Construction | 304,900,000 |
| 7 | Balfour Beatty US | 277,879,080 |
| 8 | Structure Tone | 259,250,000 |
| 9 | Jacobs | 119,930,000 |
| 10 | Gilbane Building | 104,166,000 |
| 11 | JE Dunn Construction | 89,426,706 |
| 12 | Weitz Co., The | 71,442,860 |
| 13 | James G. Davis Construction | 60,000,000 |
| 14 | Hensel Phelps Construction | 50,360,000 |
| 15 | Messer Construction | 49,404,845 |
| 16 | Hoffman Corp. | 46,541,098 |
| 17 | Manhattan Construction Group | 44,196,000 |
| 18 | Brasfield & Gorrie | 34,612,782 |
| 19 | URS Corp. | 34,475,000 |
| 20 | Sundt Construction | 28,801,944 |
| 21 | Kitchell | 24,310,000 |
| 22 | Ryan Companies US | 23,664,942 |
| 23 | Harkins Builders | 21,000,000 |
| 24 | McShane Companies, The | 20,000,000 |
| 25 | Yates Companies., The | 20,000,000 |
Related Stories
| Dec 27, 2011
Suffolk Construction celebrates raising of Boston Tea Party Ships & Museum cupola
Topping off ceremony held on 238th Anniversary of Boston Tea Party.
| Dec 27, 2011
State of the data center 2011
Advances in technology, an increased reliance on the Internet and social media as well as an increased focus on energy management initiatives have had a significant impact on the data center world.
| Dec 27, 2011
USGBC’s Center for Green Schools releases Best of Green Schools 2011
Recipient schools and regions from across the nation - from K-12 to higher education - were recognized for a variety of sustainable, cost-cutting measures, including energy conservation, record numbers of LEED certified buildings and collaborative platforms and policies to green U.S. school infrastructure.
| Dec 21, 2011
DOE report details finance options for PV systems in schools
The report examines the two primary types of ownership models used to obtain PV installations for school administrators to use in selecting the best option for deploying solar technologies in their districts.
| Dec 21, 2011
AIA Chicago & AIA Chicago Foundation 2011 Dubin Family Young Architect Award announced
The Dubin Family Young Architect Award is bestowed annually and recognizes excellence in ability and exceptional contributions by a Chicago architect between the ages of 25 and 39.
| Dec 21, 2011
Few silver linings for construction in 2012
On the brighter side, nearly half of respondents (49.7%) said their firms were in at least “good” financial health, and four-fifths (80.2%) said their companies would at least hold steady in revenue in 2012.
| Dec 21, 2011
Hoboken Terminal restoration complete
Restoration of ferry slips, expanded service to benefit commuters.
| Dec 21, 2011
BBI key to Philly high-rise renovation
The 200,000 sf building was recently outfitted with a new HVAC system and a state-of-the-art window retrofitting system.
| Dec 20, 2011
Gluckman Mayner Architects releases design for Syracuse law building
The design reflects an organizational clarity and professional sophistication that anticipates the user experience of students, faculty, and visitors alike.
| Dec 20, 2011
Research identifies most expensive U.S. commercial real estate markets
New York City, Washington, D.C. and San Mateo, Calif., rank highest in rents.


