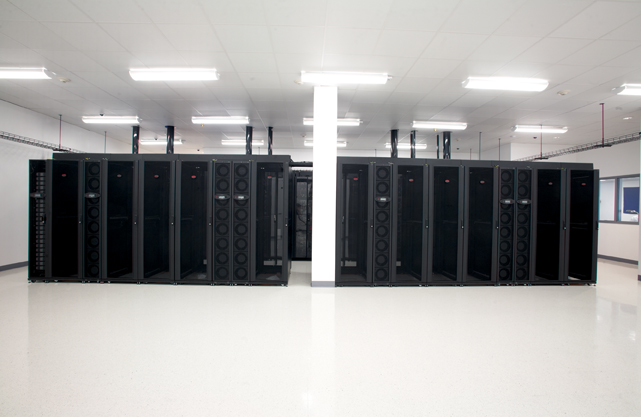
Demand for data centers is “exploding,” says Raj Gupta, PE, LEED AP, CEO of Environmental Systems Design and emeritus member of BD+C’s Editorial Board. According to Gartner Inc., in 2010, 2% of data centers contained 52% of total data center floor space and accounted for 63% of data center hardware spending.
In 2015, 2% of data centers will contain 60% of data center floor space and account for 71% of data center hardware spending.
“Traditional in-house enterprise data centers are under attack,” says Jon Hardcastle, Gartner’s research director. Virtualization technologies are helping companies to utilize their infrastructure more effectively, and data centers are getting more efficient. The move to consolidated third-party data centers is trimming the total number of midsize facilities, while large data centers are benefitting from the rise of cloud computing. +
TOP 25 DATA CENTER SECTOR ARCHITECTURE FIRMS
| Rank | Company | 2011 Data Center Revenue ($) |
| 1 | Corgan Associates | 22,854,000 |
| 2 | Gensler | 20,100,000 |
| 3 | HDR Architecture | 16,000,000 |
| 4 | LEO A DALY | 14,753,871 |
| 5 | PageSoutherlandPage | 12,890,000 |
| 6 | Integrated Design Group | 11,436,000 |
| 7 | Reynolds, Smith and Hills | 4,200,000 |
| 8 | RTKL Associates | 3,840,295 |
| 9 | CTA Architects Engineers | 3,787,800 |
| 10 | EwingCole | 3,000,000 |
| 11 | SMMA|Symmes Maini & McKee Associates | 2,123,426 |
| 12 | HLW International | 1,900,000 |
| 13 | Fentress Architects | 1,456,103 |
| 14 | Kirksey Architecture | 1,379,269 |
| 15 | PGAL | 1,096,000 |
| 16 | Heery International | 808,000 |
| 17 | Fishbeck, Thompson, Carr & Huber | 600,000 |
| 18 | Harley Ellis Devereaux | 600,000 |
| 19 | IBI Group | 563,474 |
| 20 | H+L Architecture | 537,059 |
| 21 | Ware Malcomb | 515,000 |
| 22 | Solomon Cordwell Buenz | 500,000 |
| 23 | HOK | 426,798 |
| 24 | Rule Joy Trammell + Rubio | 350,000 |
| 25 | Gresham, Smith and Partners | 234,347 |
TOP 25 DATA CENTER SECTOR ENGINEERING FIRMS
| Rank | Company | 2011 Data Center Revenue ($) |
| 1 | Fluor Corp. | 212,484,600 |
| 2 | Jacobs | 119,930,000 |
| 3 | Syska Hennessy Group | 43,577,806 |
| 4 | URS Corp. | 34,475,000 |
| 5 | Merrick & Co. | 31,500,000 |
| 6 | AKF Group | 10,500,000 |
| 7 | Atkins North America | 10,035,923 |
| 8 | Parsons Brinckerhoff | 7,400,000 |
| 9 | Eaton Energy Solutions | 6,169,598 |
| 10 | KPFF Consulting Engineers | 5,000,000 |
| 11 | H.F. Lenz Co. | 4,741,000 |
| 12 | Burns & McDonnell | 4,500,000 |
| 13 | Stantec | 4,230,000 |
| 14 | Glumac | 4,196,563 |
| 15 | Science Applications International Corp. | 3,950,000 |
| 16 | Zak Companies | 3,043,228 |
| 17 | Michael Baker Jr., Inc | 2,970,000 |
| 18 | R.G. Vanderweil Engineers | 2,830,900 |
| 19 | RMF Engineering | 2,500,000 |
| 20 | ESD|Environmental Systems Design | 2,450,000 |
| 21 | H&A Architects & Engineers | 2,300,000 |
| 22 | RDK Engineers | 2,245,000 |
| 23 | Guernsey | 2,041,552 |
| 24 | Middough | 1,750,000 |
| 25 | M+W U.S. | 1,654,867 |
TOP 25 DATA CENTER SECTOR CONSTRUCTION FIRMS
| Rank | Company | 2011 Data Center Revenue ($) |
| 1 | Holder Construction | 1,293,000,000 |
| 2 | DPR Construction | 666,292,020 |
| 3 | Turner Corporation, The | 434,435,518 |
| 4 | Whiting-Turner Contracting, The | 393,539,085 |
| 5 | Skanska USA | 369,889,632 |
| 6 | Mortenson Construction | 304,900,000 |
| 7 | Balfour Beatty US | 277,879,080 |
| 8 | Structure Tone | 259,250,000 |
| 9 | Jacobs | 119,930,000 |
| 10 | Gilbane Building | 104,166,000 |
| 11 | JE Dunn Construction | 89,426,706 |
| 12 | Weitz Co., The | 71,442,860 |
| 13 | James G. Davis Construction | 60,000,000 |
| 14 | Hensel Phelps Construction | 50,360,000 |
| 15 | Messer Construction | 49,404,845 |
| 16 | Hoffman Corp. | 46,541,098 |
| 17 | Manhattan Construction Group | 44,196,000 |
| 18 | Brasfield & Gorrie | 34,612,782 |
| 19 | URS Corp. | 34,475,000 |
| 20 | Sundt Construction | 28,801,944 |
| 21 | Kitchell | 24,310,000 |
| 22 | Ryan Companies US | 23,664,942 |
| 23 | Harkins Builders | 21,000,000 |
| 24 | McShane Companies, The | 20,000,000 |
| 25 | Yates Companies., The | 20,000,000 |
Related Stories
| Jan 19, 2011
Architecture Billings Index jumped more than 2 points in December
On the heels of its highest mark since 2007, the Architecture Billings Index jumped more than two points in December. The American Institute of Architects reported the December ABI score was 54.2, up from a reading of 52.0 the previous month.
| Jan 19, 2011
Large-Scale Concrete Reconstruction Solid Thinking
Driven by both current economic conditions and sustainable building trends, Building Teams are looking more and more to retrofits and reconstruction as the most viable alternative to new construction. In that context, large-scale concrete restoration projects are playing an important role within this growing specialty.
| Jan 10, 2011
Architect Jean Nouvel designs an island near Paris
Abandoned by carmaker Renault almost 20 years ago, Seguin Island in Boulogne-Billancourt, France, is being renewed by architect Jean Nouvel. Plans for the 300,000-square-meter project includes a mix of culture, commerce, urban parks, and gardens, which officials hope will attract both Parisians and tourists.
| Jan 10, 2011
Michael J. Alter, president of The Alter Group: ‘There’s a significant pent-up demand for projects’
Michael J. Alter, president of The Alter Group, a national corporate real estate development firm headquartered in Skokie, Ill., on the growth of urban centers, project financing, and what clients are saying about sustainability.
| Jan 7, 2011
BIM on Target
By using BIM for the design of its new San Clemente, Calif., store, big-box retailer Target has been able to model the entire structural steel package, including joists, in 3D, chopping the timeline for shop drawings from as much as 10 weeks down to an ‘unheard of’ three-and-a-half weeks.
| Jan 7, 2011
How Building Teams Choose Roofing Systems
A roofing survey emailed to a representative sample of BD+C’s subscriber list revealed such key findings as: Respondents named metal (56%) and EPDM (50%) as the roofing systems they (or their firms) employed most in projects. Also, new construction and retrofits were fairly evenly split among respondents’ roofing-related projects over the last couple of years.
| Jan 7, 2011
Total construction to rise 5.1% in 2011
Total U.S. construction spending will increase 5.1% in 2011. The gain from the end of 2010 to the end of 2011 will be 10%. The biggest annual gain in 2011 will be 10% for new residential construction, far above the 2-3% gains in all other construction sectors.
| Jan 7, 2011
Mixed-Use on Steroids
Mixed-use development has been one of the few bright spots in real estate in the last few years. Successful mixed-use projects are almost always located in dense urban or suburban areas, usually close to public transportation. It’s a sign of the times that the residential component tends to be rental rather than for-sale.


