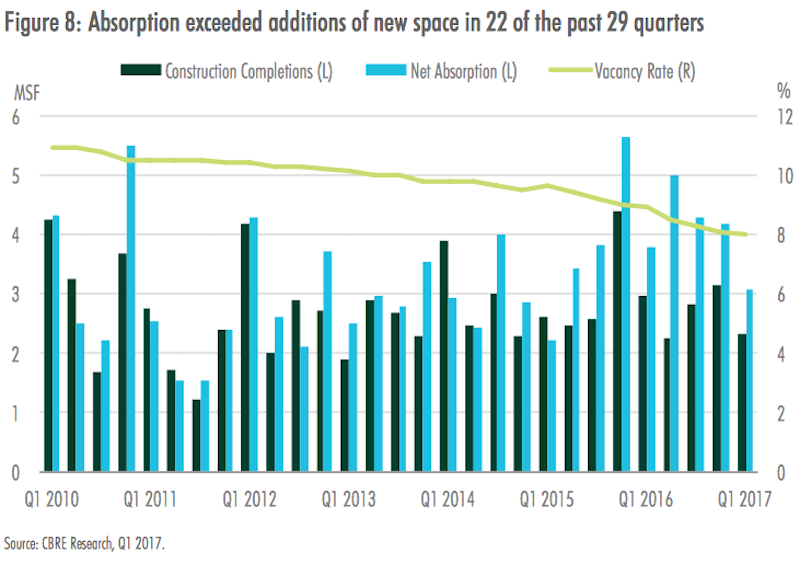
National construction of medical office buildings (MOBs) stood at 12.5 million sf in the first quarter of 2017, down slightly from a few years ago but still well above recession-era levels. However, construction continues to be outpaced by net absorptions, which between 2015 and Q1 2017 totaled 35.4 million sf, or 38% higher than completions over that same period.
In its first-ever report on U.S. Medical Office Buildings, CBRE notes that the vacancy rate for MOBs has “tightened steadily” since 2010, to its current level of 8%, a record low for this sector and well below the 13% vacancy rate for the U.S. office market.
To assess what’s driving MOB demand and development, CBRE took looked at Class A and B buildings with at least 10,000 sf of rentable area specifically designated as medical office space in 30 metros, with detailed investment and demographic profiles of each city.
It found a “resilient” MOB market that continues to benefit from several factors, not the least of which being the population growth of senior citizens. The U.S. Census Bureau estimates that the 65-plus population will nearly double between 2015 and 2055 to more than 92 million, and comprise nearly 23% of the country’s total population.
“The steep increase in both the 65+ population and anticipated greater need for in-office physician services by this group signal a continued increase in demand for health care services and medical office space in the decades ahead,” CBRE states.
Markets where the 65+ population is expected to grow strongest over the next five years include Las Vegas, Phoenix, Atlanta, Dallas-Fort Worth, Houston, and South Florida, according to Moody’s Analytics.
CBRE observes that providers are attempting to stem perennially increasing healthcare expenditures by moving more patient volume away from hospitals and toward more cost-effective outpatient facilities, such as MOBs and urgent-care centers.
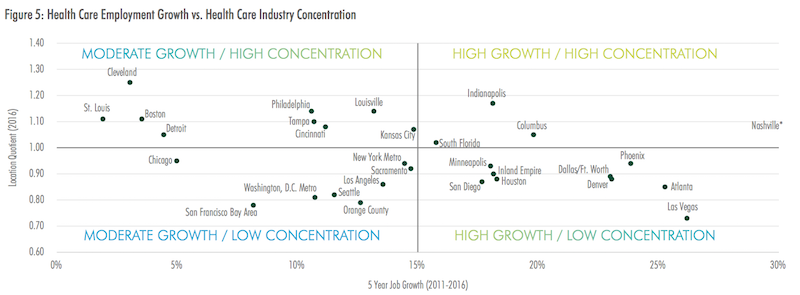
Health care jobs, particularly physicians, have been added at a much faster pace than jobs overall. Image: CBRE
Another cost-cutting trend that’s impacting healthcare real estate, says CBRE, has been the “significant uptick” in mergers and acquisitions. Consolidation among physician medical groups has been particularly strong, with deal volume surging by 19% in 2016 and 109% year-over-year in Q1 2017, according to PwC.
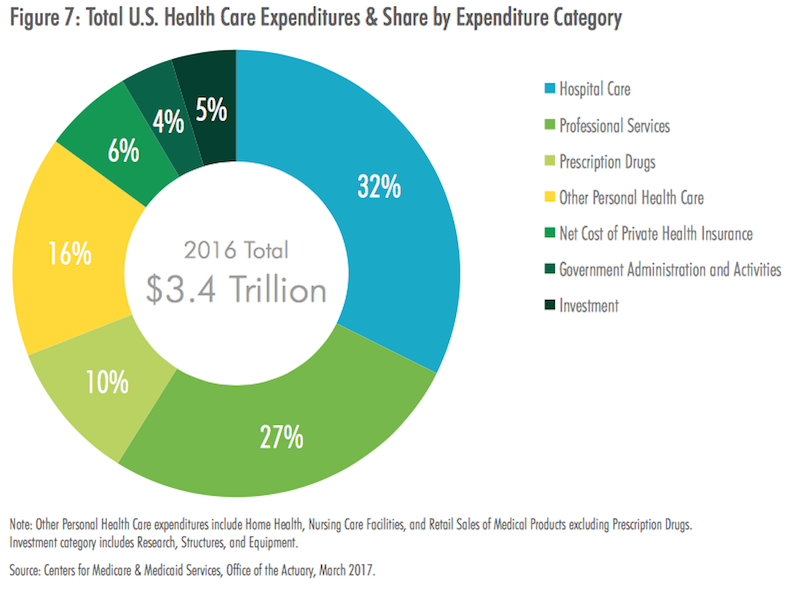
Outpatient professional services are not as expensive as hospital care, but they still accounted for nealry $900 billion in 2016. Image: CBRE.
Overall asking rents for medical office properties have remained relatively stable over the past seven years, ranging between $22 and $23 per sf per year. CBRE explains that the high cost of tenant build-outs, as well as the importance of proximity to a provider’s patient base and ancillary medical services, compel many tenants to remain in place for long periods of time.
But rent appreciation varies widely by market; average rents in New York, for example, grew by 83% since Q1 2010 to over $68 per sf in Q1 2017. Indeed, almost all of the 30 markets examined registered rent increases over the past year. And investors surveyed expect MOB rents to increase between 1% and 3% this year.
Low vacancy rates in this sector are attributed, in part, to the widening gap between completions and absorptions over the past three years.
On a yearly basis, net absorption has been increasing since 2011 when it totaled 8.1 million sf. Since then, annual absorption grew by 114% to 17.2 million sf in 2016. Four of the five markets with the most positive net absorption in 2016 were located in the South or West: Houston (436,300 sf) Tampa (413,800 sf) Phoenix (314,400 sf) and South Florida (310,703 sf). Indianapolis was the lone top market not located in the Sun Belt, ranking third with 383,700 sf of positive absorption.
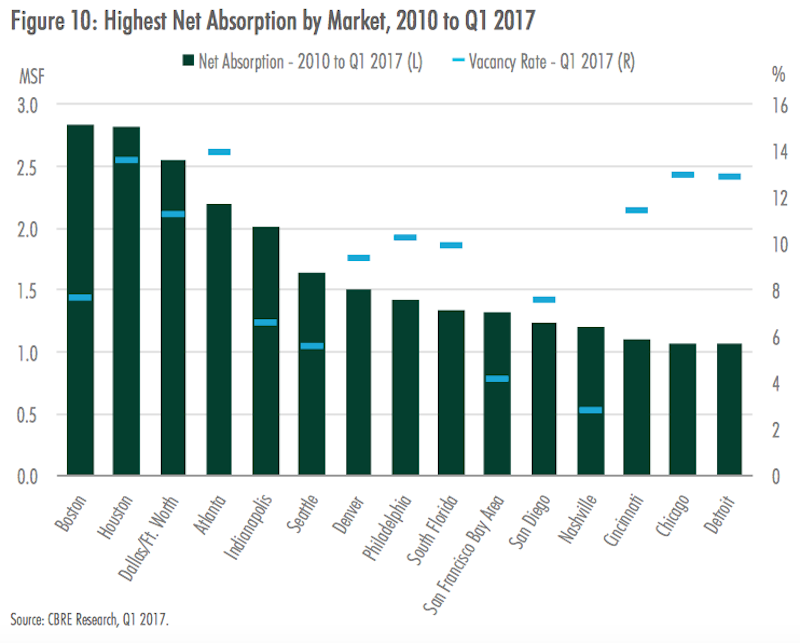
This chart compares cities' net absorptions of MOBs with their vacancy rates for that building type. Image: CBRE
New construction of MOBs is not keeping up with demand, based on net absorption rates for 30 large metros. Image: CBRE
CBRE found that as investors’ appetites for healthcare-related properties have increased, MOBs “have emerged as the most popular property type within the niche.” Ninety-seven percent of investors surveyed in 2017 were most interested in medical office properties among all health care-related real estate that met their investment criteria.
CBRE cites Real Capital Analytics research that estimates total U.S. investment volume in MOBs of at least 10,000 sf at $10.2 billion in 2016, compared to just under $4 billion in 2010. The investment total in 2016 exceeded the previous annual peak of $7.3 billion in 2006.
The Southeast and Western regions have captured a combined 44% of total MOB investment since 2010. California accounted for 56% of the western region MOB investment, with Greater Los Angeles alone representing 37% of the region’s total.
Consolidation has been a major driver of new medical office construction in recent years, as many markets lacked enough large blocks of space to meet the requirements of newly expanded health care provider groups, particularly within close to hospital campuses.
Construction has been abetted by the healthcare systems’ focus on value-based care rather than a fee-for-service approach, which has amplified the need for effective communication across provider teams, driving the need for efficient space that facilitates collaboration.
Over the past two years, completions were highest in the medical hubs of Boston and Houston, each with more than 1.2 million sf of new product delivered. Conversely, only four of the 30 markets analyzed—New York, San Francisco, Orange County, Calif., and Louisville—have had no new completions since Q2 2015.
Related Stories
Design Innovation Report | Apr 27, 2023
BD+C's 2023 Design Innovation Report
Building Design+Construction’s Design Innovation Report presents projects, spaces, and initiatives—and the AEC professionals behind them—that push the boundaries of building design. This year, we feature four novel projects and one building science innovation.
Sustainability | Apr 20, 2023
13 trends, technologies, and strategies to expect in 2023
Biophilic design, microgrids, and decarbonization—these are three of the trends, technologies, and strategies IMEG’s market and service leaders believe are poised to have a growing impact on the built environment.
Design Innovation Report | Apr 19, 2023
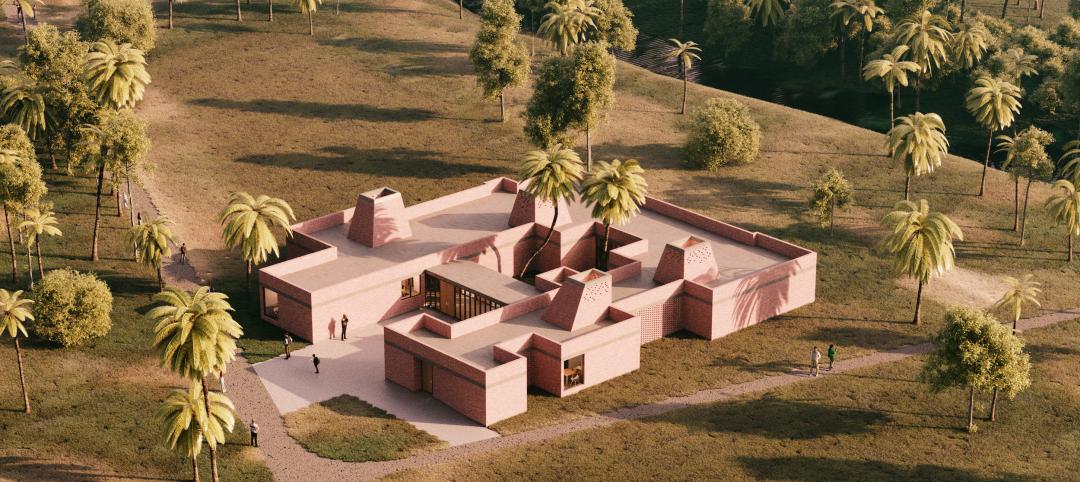
HDR uses artificial intelligence tools to help design a vital health clinic in India
Architects from HDR worked pro bono with iKure, a technology-centric healthcare provider, to build a healthcare clinic in rural India.
Healthcare Facilities | Apr 17, 2023
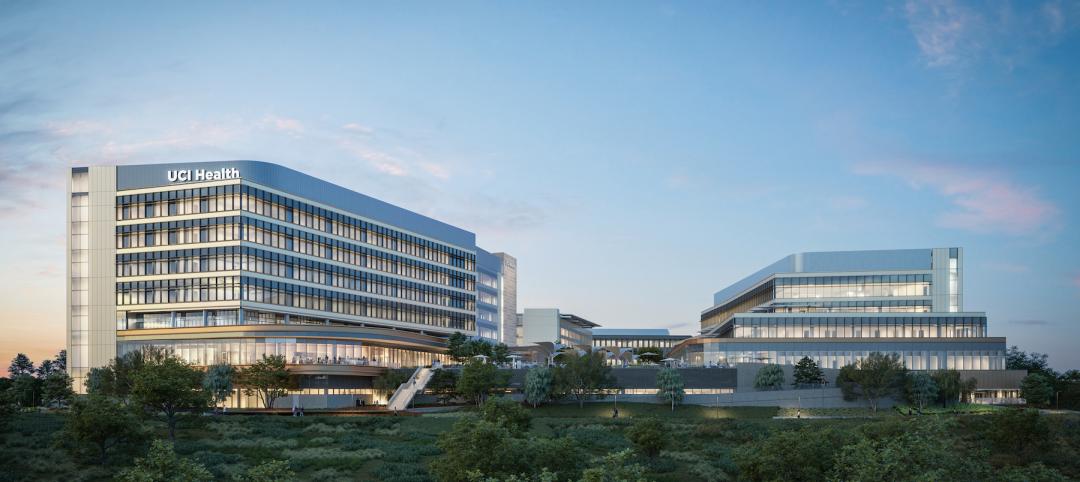
UC Irvine takes sustainability to new level with all-electric medical center
The University of California at Irvine (UCI) has a track record for sustainability. Its under-construction UCI Medical Center is designed, positioned, and built to preserve the nearby San Joaquin Marsh Reserve, to reduce the facility’s solar gain by 85%, and to be the first medical center in the country to operate on an all-electric central plant.
Healthcare Facilities | Apr 13, 2023
Healthcare construction costs for 2023
Data from Gordian breaks down the average cost per square foot for a three-story hospital across 10 U.S. cities.
Healthcare Facilities | Apr 13, 2023
Urgent care facilities: Intentional design for mental and behavioral healthcare
The emergency department (ED) is the de-facto front door for behavior health crises, and yet these departments are understaffed, overwhelmed, and ill-equipped to navigate the layered complexities of highly demanding physical and behavioral health needs.
Urban Planning | Apr 12, 2023
Watch: Trends in urban design for 2023, with James Corner Field Operations
Isabel Castilla, a Principal Designer with the landscape architecture firm James Corner Field Operations, discusses recent changes in clients' priorities about urban design, with a focus on her firm's recent projects.
Market Data | Apr 11, 2023
Construction crane count reaches all-time high in Q1 2023
Toronto, Seattle, Los Angeles, and Denver top the list of U.S/Canadian cities with the greatest number of fixed cranes on construction sites, according to Rider Levett Bucknall's RLB Crane Index for North America for Q1 2023.
Contractors | Apr 10, 2023
What makes prefabrication work? Factors every construction project should consider
There are many factors requiring careful consideration when determining whether a project is a good fit for prefabrication. JE Dunn’s Brian Burkett breaks down the most important considerations.
Architects | Apr 6, 2023
New tool from Perkins&Will will make public health data more accessible to designers and architects
Called PRECEDE, the dashboard is an open-source tool developed by Perkins&Will that draws on federal data to identify and assess community health priorities within the U.S. by location. The firm was recently awarded a $30,000 ASID Foundation Grant to enhance the tool.


