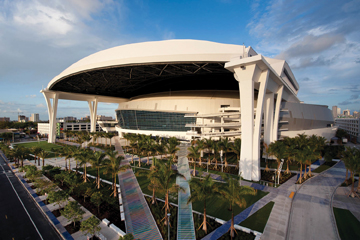
The new Marlins Ballpark, located in Little Havana, Miami’s largest and most diverse neighborhood, opened in this past April. Situated atop the former location of the Orange Bowl, the $515 million, 928,000-sf LEED Gold ballpark pays tribute to Miami’s art deco heritage and grand majestic architecture, as well as its Caribbean influence and proximity to the Atlantic Ocean.
TOP 25 SPORTS FACILITIES SECTOR ARCHITECTURE FIRMS
| Rank | Company | 2011 Sports Facilities Revenue ($) |
| 1 | Populous | 81,200,000 |
| 2 | HKS | 15,181,855 |
| 3 | Gensler | 11,500,000 |
| 4 | Heery International | 9,080,000 |
| 5 | HNTB Architecture | 7,626,938 |
| 6 | DLR Group | 7,500,000 |
| 7 | Perkins+Will | 5,897,764 |
| 8 | Solomon Cordwell Buenz | 5,000,000 |
| 9 | Wight & Company | 4,932,700 |
| 10 | EwingCole | 4,000,000 |
| 11 | PBK | 3,140,000 |
| 12 | NBBJ | 2,681,000 |
| 13 | Smallwood, Reynolds, Stewart, Stewart & Assoc. | 2,612,714 |
| 14 | Skidmore, Owings & Merrill | 2,044,000 |
| 15 | IBI Group | 1,848,450 |
| 16 | Sasaki Associates | 1,812,490 |
| 17 | ZGF Architects | 1,698,520 |
| 18 | Good Fulton & Farrell | 1,369,740 |
| 19 | Gould Evans | 1,246,000 |
| 20 | Tetra Tech Architects & Engineers | 1,200,000 |
| 21 | HDR Architecture | 1,000,000 |
| 22 | BBS Architects, Landscape Architects and Engineers | 930,000 |
| 23 | LPA | 926,812 |
| 24 | Rosser International | 803,000 |
| 25 | KZF Design | 780,871 |
TOP 25 SPORTS FACILITIES SECTOR ENGINEERING FIRMS
| Rank | Company | 2011 Sports Facilities Revenue ($) |
| 1 | Aecom Technology Corp. | 217,000,000 |
| 2 | Thornton Tomasetti | 14,880,000 |
| 3 | URS Corp. | 14,000,000 |
| 4 | Jacobs | 8,310,000 |
| 5 | WSP USA | 6,500,000 |
| 6 | Stantec | 6,345,000 |
| 7 | Magnusson Klemencic Associates | 5,299,453 |
| 8 | Walter P Moore | 4,664,444 |
| 9 | Smith Seckman Reid | 4,100,000 |
| 10 | Henderson Engineers | 3,000,000 |
| 11 | Paulus, Sokolowski and Sartor | 2,300,000 |
| 12 | Wiss, Janney, Elstner Associates | 2,204,000 |
| 13 | Dewberry | 1,893,804 |
| 14 | L.R. Kimball, a CDI Company | 1,482,000 |
| 15 | Simpson Gumpertz & Heger | 1,380,000 |
| 16 | TLC Engineering for Architecture | 1,337,385 |
| 17 | French & Parrello Associates | 1,269,167 |
| 18 | Guernsey | 1,045,269 |
| 19 | Rist-Frost-Shumway Engineering | 1,004,000 |
| 20 | KPFF Consulting Engineers | 1,000,000 |
| 21 | TTG|TMAD Taylor & Gaines | 925,200 |
| 22 | Clark Nexsen | 856,991 |
| 23 | Birdsall Services Group | 850,000 |
| 24 | Environmental Systems Design | 830,000 |
| 25 | RMH Group, Inc., The | 816,401 |
TOP 25 SPORTS FACILITES SECTOR CONSTRUCTION FIRMS
| Rank | Company | 2011 Sports Facilities Revenue ($) |
| 1 | Turner Corporation, The | 560,933,000 |
| 2 | Hunt Construction Group | 537,500,000 |
| 3 | Mortenson Construction | 293,720,000 |
| 4 | PCL Construction Enterprises | 284,986,506 |
| 5 | Manhattan Construction Group | 150,698,000 |
| 6 | Barton Malow | 121,621,680 |
| 7 | Tutor Perini | 119,151,000 |
| 8 | Bernards | 85,000,000 |
| 9 | Flintco | 65,400,000 |
| 10 | Webcor Builders | 63,165,105 |
| 11 | Austin Industries | 63,059,963 |
| 12 | Suffolk Construction | 44,306,488 |
| 13 | Balfour Beatty US | 42,992,640 |
| 14 | Robins & Morton | 38,500,000 |
| 15 | Hoar Construction | 36,854,000 |
| 16 | CORE Construction | 34,828,992 |
| 17 | C.W. Driver | 33,024,000 |
| 18 | S. M. Wilson & Co. | 24,642,795 |
| 19 | Weitz Company, The | 20,300,000 |
| 20 | Skanska USA | 19,147,583 |
| 21 | Choate Construction | 17,944,119 |
| 22 | EMJ Corp. | 17,735,406 |
| 23 | Yates Companies, Inc., The | 17,100,000 |
| 24 | Hoffman Corp. | 15,748,494 |
| 25 | Linbeck Group | 15,000,000 |
Related Stories
Hotel Facilities | Apr 25, 2022
U.S. hotel construction pipeline up 2%, with 5,090 projects in the works
The total U.S. hotel construction pipeline stands at 5,090 projects and 606,302 rooms at the end of the first quarter of 2022, up 2% by projects, but down 3% by rooms, according to the Q1 2022 Construction Pipeline Trend Report for the United States from Lodging Econometrics (LE).
Codes and Standards | Apr 25, 2022
Supply chain constraints, shifting consumer demands adding cost pressures to office fit-outs
Cushman & Wakefield’s 2022 Americas Office Fit-Out Cost Guide found supply chain constraints and shifting consumer demands will continue to add pressure to costs, both in materials and labor.
Sports and Recreational Facilities | Apr 25, 2022
Iowa's Field of Dreams to get boutique hotel, new baseball fields
A decade ago, Go the Distance Baseball formed to preserve the Iowa farm site where the 1989 movie Field of Dreams was filmed.
Building Team | Apr 22, 2022
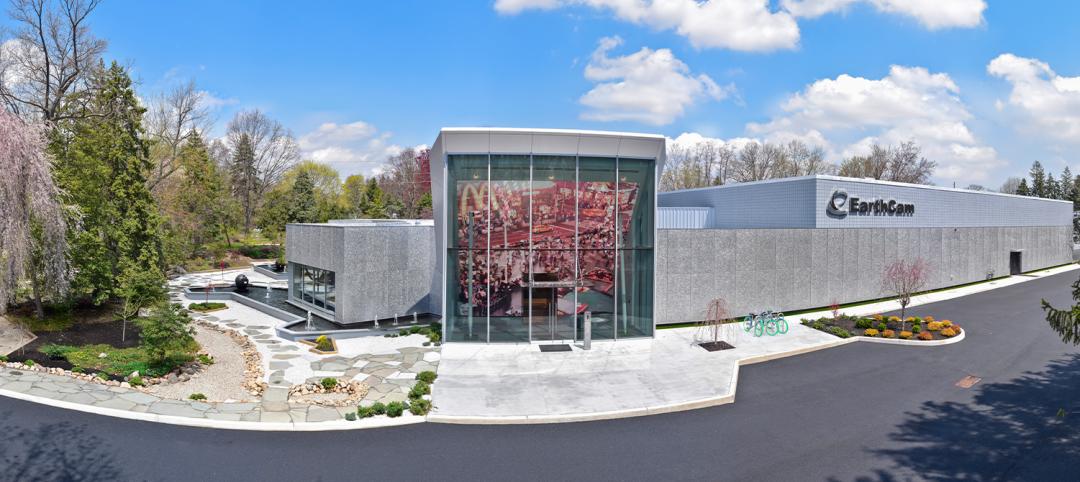
EarthCam Adds Senior Leadership Roles to Facilitate Rapid Growth
EarthCam today announced several new leadership positions as it scales up to accommodate increasing demand for its webcam technology and services.
Architects | Apr 22, 2022
Top 10 green building projects for 2022
The American Institute of Architects' Committee on the Environment (COTE) has announced its COTE Top Ten Awards for significant achievements in advancing climate action.
Mixed-Use | Apr 22, 2022
San Francisco replaces a waterfront parking lot with a new neighborhood
A parking lot on San Francisco’s waterfront is transforming into Mission Rock—a new neighborhood featuring rental units, offices, parks, open spaces, retail, and parking.
Legislation | Apr 21, 2022
NIMBYism in the Sunbelt stymies new apartment development
Population growth in Sunbelt metro areas is driving demand for new apartment development, but resistance is growing against these projects.
Architects | Apr 21, 2022
A conversation with architect Robert A.M. Stern
The architect Robert A.M. Stern discusses his newly published memoir that touches on his childhood in New York and 50-plus-year career.
Building Team | Apr 20, 2022
White House works with state, local governments to bolster building performance standards
The former head of the U.S. Green Building Council says the Biden Administration’s formation of the National Building Performance Standards Coalition is a “tremendous” step in the right direction to raise building performance standards in the U.S.
Market Data | Apr 20, 2022
Pace of demand for design services rapidly accelerates
Demand for design services in March expanded sharply from February according to a new report today from The American Institute of Architects (AIA).


