


High-end hotels in the U.S. have been having a good 2012 and can expect to do even better next year, with average daily room rates expected to be up 5.3% in 2013 compared to 4.7% this year and the 2.8% long-term average, according to PKF Hospitality Research. That bodes well for firms doing hotel design and construction.
On the retail side, the ULI Center for Capital Markets and Real Estate forecasts vacancy rates to begin to turn around this year, down to 12.5% in 2013. Retail rentals should be up 2.0% next year, says the ULI. +
TOP 10 HOSPITALITY SECTOR ARCHITECTURE FIRMS
| Rank | Company | 2011 Hospitality Revenue ($) |
| 1 | WATG | 54,939,171 |
| 2 | Gensler | 51,750,000 |
| 3 | HKS | 32,336,523 |
| 4 | HOK | 18,287,163 |
| 5 | Hnedak Bobo Group | 14,580,025 |
| 6 | tvsdesign | 14,188,382 |
| 7 | RTKL Associates | 13,970,968 |
| 8 | BLT Architects | 12,200,000 |
| 9 | BBG-BBGM | 12,058,000 |
| 10 | Perkins Eastman | 11,050,000 |
TOP 10 HOSPITALITY SECTOR ENGINEERING FIRMS
| Rank | Company | 2011 Hospitality Revenue ($) |
| 1 | AECOM Technology Corp. | 296,000,000 |
| 2 | Parsons Brinckerhoff | 17,600,000 |
| 3 | Rolf Jensen & Associates | 9,000,000 |
| 4 | Arup | 8,838,492 |
| 5 | Jacobs | 6,310,000 |
| 6 | KPFF Consulting Engineers | 6,000,000 |
| 7 | Thornton Tomasetti | 5,850,000 |
| 8 | WSP USA | 5,300,000 |
| 9 | Michael Baker Jr., Inc. | 4,340,000 |
| 10 | Stantec | 4,230,000 |
TOP 10 HOSPITALITY SECTOR CONSTRUCTION FIRMS
| Rank | Company | 2011 Hospitality Revenue ($) |
| 1 | Tutor Perini Corp. | 839,703,000 |
| 2 | Swinerton | 243,415,560 |
| 3 | Hardin Construction | 239,457,598 |
| 4 | Structure Tone | 223,330,000 |
| 5 | Balfour Beatty US | 170,785,709 |
| 6 | Hunt Construction Group | 164,500,000 |
| 7 | Yates Co., The | 137,600,000 |
| 8 | Weitz Co., The | 118,200,000 |
| 9 | Pepper Construction Group | 89,843,000 |
| 10 | Manhattan Construction Group | 84,325,000 |
TOP 10 RETAIL SECTOR ARCHITECTURE FIRMS
| Rank | Company | 2011 Retail Revenue ($) |
| 1 | Gensler | 84,700,000 |
| 2 | RTKL Associates | 58,957,056 |
| 3 | MulvannyG2 Architecture | 42,033,036 |
| 4 | WD Partners | 35,294,000 |
| 5 | Perkowitz+Ruth Architects | 32,686,910 |
| 6 | MBH Architects | 30,541,000 |
| 7 | RSP Architects | 17,641,000 |
| 8 | FRCH Design Worldwide | 16,630,000 |
| 9 | LawKingdon Architecture | 15,600,000 |
| 10 | CASCO Diversified Corp. | 14,650,000 |
TOP 10 RETAIL SECTOR ENGINEERING FIRMS
| Rank | Company | 2011 Retail Revenue ($) |
| 1 | AECOM Technology Corp. | 136,000,000 |
| 2 | Jacobs | 60,550,000 |
| 3 | Stantec | 59,220,000 |
| 4 | Henderson Engineers | 47,600,000 |
| 5 | URS Corp. | 23,650,000 |
| 6 | Parsons Brinckerhoff | 21,700,000 |
| 7 | Wiss, Janney, Elstner Associates | 18,562,000 |
| 8 | Bergmann Associates | 14,200,000 |
| 9 | Science Applications Int’l Corp. | 11,860,000 |
| 10 | Wallace Engineering | 7,210,000 |
TOP 10 RETAIL SECTOR CONSTRUCTION FIRMS
| Rank | Company | 2011 Retail Revenue ($) |
| 1 | Whiting-Turner Contracting Co., The | 396,821,222 |
| 2 | Shawmut Design and Construction | 276,700,000 |
| 3 | PCL Construction Enterprises | 188,344,721 |
| 4 | EMJ Corp. | 164,437,662 |
| 5 | Weitz Co., The | 136,700,000 |
| 6 | Structure Tone | 97,500,000 |
| 7 | O’Neil Industries / W.E. O’Neil | 96,620,000 |
| 8 | Ryan Companies US | 92,895,680 |
| 9 | E.W. Howell | 79,395,000 |
| 10 | KBE Building Corp. | 70,365,040 |
Related Stories

| Nov 11, 2013
4 trends driving the recovering commercial construction sector
Jones Lang LaSalle research reveals a four-point “new look” for the post-recession construction industry.

| Nov 8, 2013
Oversized healthcare: How did we get here and how do we right-size?
Healthcare facilities, especially our nation's hospitals, have steadily become larger over the past couple of decades. The growth has occurred despite stabilization, and in some markets, a decline in inpatient utilization.

| Nov 8, 2013
Can Big Data help building owners slash op-ex budgets?
Real estate services giant Jones Lang LaSalle set out to answer these questions when it partnered with Pacific Controls to develop IntelliCommand, a 24/7 real-time remote monitoring and control service for its commercial real estate owner clients.

| Nov 8, 2013
S+T buildings embrace 'no excuses' approach to green labs
Some science-design experts once believed high levels of sustainability would be possible only for low-intensity labs in temperate zones. But recent projects prove otherwise.

| Nov 8, 2013
Net-zero bellwether demonstrates extreme green, multifamily style
The 10-unit zHome in Issaquah Highlands, Wash., is the nation’s first net-zero multifamily project, as certified this year by the International Living Future Institute.
| Nov 8, 2013
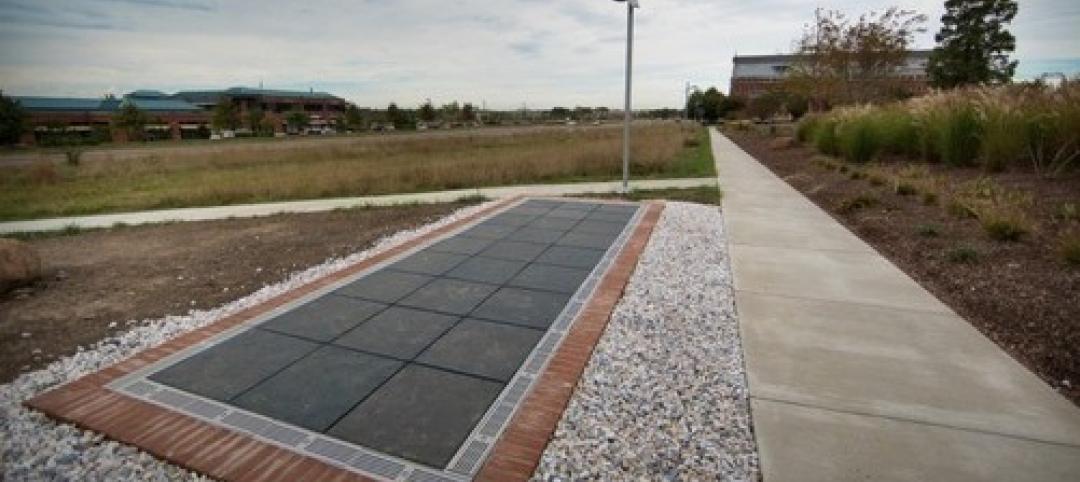
Walkable solar pavement debuts at George Washington University
George Washington University worked with supplier Onyx Solar to design and install 100 sf of walkable solar pavement at its Virginia Science and Technology Campus in Ashburn, Va.

| Nov 6, 2013
PECI tests New Buildings Institute’s plug load energy use metrics at HQ
Earlier this year, PECI used the NBI metrics to assess plug load energy use at PECI headquarters in downtown Portland, Ore. The study, which informed an energy-saving campaign, resulted in an 18 percent kWh reduction of PECI’s plug load.
 Elementary School is among a number of net-zero-ready schools planned in the Lone Star State. Energy-ef")
| Nov 5, 2013
Net-zero movement gaining traction in U.S. schools market
As more net-zero energy schools come online, school officials are asking: Is NZE a more logical approach for school districts than holistic green buildings?

| Nov 5, 2013
New IECC provision tightens historic building exemption
The International Energy Conservation Code has been revised to eliminate what has been seen as a blanket exemption for historic buildings.

| Nov 5, 2013
Living Building Challenge clarifies net-zero definitions and standards
The Living Building Challenge has released the Net Zero Energy Building Certification to provide clearer definitions regarding what net zero really means and how it is to be achieved.


