

 Regional Transportation Intermodal Center is a project of the cit")
Federal, state, and local government construction hasn’t exactly been a steamroller for the past few years, due to the end of stimulus availability and the ongoing effects of budget sequestration.
At press time, the most recent Commerce Department report indicated that government construction spending was up just under 1% in April, to a seasonally adjusted annual rate of $267 billion, despite overall economic contraction of about 1% in the first quarter. Federal construction spending was the growth leader, rising by 1.9% to a rate of $23.5 billion. State and local projects—a much larger piece of the public pie—were up just 0.7%, to $243.5 billion.
Among non-infrastructure public construction spending categories, healthcare (up 6%) and education (up 2%) appear most promising for this year, according to the Associated Builders and Contractors’ 2014 forecast.
Improving energy performance of existing properties through targeted upgrades—and, sometimes, large-scale reconstruction—continues to be a federal priority. Of 20 projects recently honored by the General Services Administration’s Design Awards program, half were reconstruction jobs, ranging from Beaux Arts courthouses to Modernist offices.
Along with the push for energy efficiency, federal agencies are increasingly exploring telework as an alternative to expanding office space. The bright side? Telecom and AV renovations will be required to help agencies keep off-site staff connected.
Many state and local governments continue to struggle with the sluggish overall economy, causing delays in needed construction. Among the discernible themes among state and local projects submitted to BD+C: new police facilities (designed to reflect changing ideas about community policing), replacement and upgraded courthouses, and mass-transit stations.
Top Government Sector Architecture Firms
| Rank | Company | 2013 Government Revenue |
| 1 | Stantec | $144,299,056 |
| 2 | Heery International | 125,058,364 |
| 3 | HOK | 114,753,666 |
| 4 | SmithGroupJJR | 83,064,158 |
| 5 | HDR | 81,601,164 |
| 6 | Skidmore, Owings & Merrill | 57,835,664 |
| 7 | SHW Group | 56,007,000 |
| 8 | Gensler | 52,272,600 |
| 9 | EYP Architecture & Engineering | 42,800,000 |
| 10 | RS&H | 39,200,000 |
| 11 | Page | 38,704,000 |
| 12 | Moseley Architects | 35,135,469 |
| 13 | Leo A Daly | 29,483,542 |
| 14 | Perkins+will | 28,975,375 |
| 15 | Clark Nexsen | 28,873,388 |
| 16 | ZGF Architects | 27,425,548 |
| 17 | CannonDesign | 27,000,000 |
| 18 | FreemanWhite | 25,941,154 |
| 19 | NBBJ | 19,382,000 |
| 20 | DLR Group | 19,300,000 |
| 21 | Hammel, Green and Abrahamson | 19,167,839 |
| 22 | EwingCole | 17,300,000 |
| 23 | HKS | 17,247,862 |
| 24 | PGAL | 16,097,917 |
| 25 | HNTB Corp. | 15,269,498 |
| 26 | Westlake Reed Leskosky | 15,049,000 |
| 27 | Quattrocchi Kwok Architects | 13,230,000 |
| 28 | Hoefer Wysocki Architecture | 12,860,000 |
| 29 | Fentress Architects | 12,160,971 |
| 30 | BLDD Architects | 11,800,000 |
| 31 | RTKL Associates | 11,469,000 |
| 32 | SchenkelShultz Architecture | 11,278,000 |
| 33 | NORR | 9,792,248 |
| 34 | LS3P | 8,882,375 |
| 35 | Morris Architects | 8,350,000 |
| 36 | Davis Brody Bond | 8,263,108 |
| 37 | LaBella Associates | 8,130,000 |
| 38 | CTA Architects Engineers | 8,014,884 |
| 39 | Beyer Blinder Belle | 7,947,688 |
| 40 | HMC Architects | 6,811,005 |
| 41 | VOA Associates | 6,808,200 |
| 42 | Parkhill, Smith & Cooper | 6,687,000 |
| 43 | Rosser International | 6,652,324 |
| 44 | LMN Architects | 6,388,100 |
| 45 | Sherlock, Smith & Adams | 6,388,000 |
| 46 | Becker Morgan Group | 6,343,277 |
| 47 | Flad Architects | 6,126,870 |
| 48 | KZF Design | 5,887,462 |
| 49 | Epstein | 5,402,000 |
| 50 | IBI Group ? Gruzen Samton | 5,000,000 |
| 51 | Solomon Cordwell Buenz | 4,500,000 |
| 52 | Goodwyn Mills & Cawood | 4,409,249 |
| 53 | Wight & Company | 4,402,093 |
| 54 | RSP Architects | 4,326,000 |
| 55 | Harley Ellis Devereaux | 4,310,000 |
| 56 | Carrier Johnson + Culture | 4,066,891 |
| 57 | BRPH | 3,957,000 |
| 58 | FGM Architects | 3,776,698 |
| 59 | Ennead Architects | 3,729,000 |
| 60 | RNL | 3,418,000 |
| 61 | WDG Architecture | 3,095,000 |
| 62 | Perkins Eastman | 3,000,000 |
| 63 | GWWO | 2,965,804 |
| 64 | Gresham, Smith and Partners | 2,787,930 |
| 65 | Integrus Architecture | 2,705,119 |
| 66 | Hoffmann Architects | 2,654,000 |
| 67 | Swanke Hayden Connell Architects | 2,534,000 |
| 68 | Ratio Architects | 2,462,355 |
| 69 | LPA | 2,205,538 |
| 70 | Emersion Design | 2,183,039 |
| 71 | Array Architects | 2,138,000 |
| 72 | WHR Architects | 2,076,445 |
| 73 | Cooper Carry | 1,987,669 |
| 74 | Little | 1,961,000 |
| 75 | Bergmann Associates | 1,941,360 |
| 76 | OZ Architecture | 1,724,680 |
| 77 | Legat Architects | 1,675,500 |
| 78 | LBL Architects | 1,600,000 |
| 79 | Schrader Group Architecture | 1,573,559 |
| 80 | Symmes Maini & McKee Associates | 1,563,000 |
| 81 | Good Fulton & Farrell | 1,373,500 |
| 82 | H+L Architecture | 1,295,496 |
| 83 | Harvard Jolly Architecture | 1,221,576 |
| 84 | Cambridge Seven Associates | 1,210,000 |
| 85 | FXFOWLE Architects | 1,180,000 |
| 86 | Smallwood, Reynolds, Stewart, Stewart & Associates | 1,128,560 |
| 87 | Moody Nolan | 1,083,924 |
| 88 | CO Architects | 1,031,600 |
| 89 | Shepley Bulfinch | 836,000 |
| 90 | Corgan | 762,894 |
| 91 | Cuningham Group Architecture | 742,891 |
| 92 | Lord Aeck Sargent | 742,273 |
| 93 | GBBN Architects | 660,000 |
| 94 | Nadel | 650,000 |
| 95 | Eppstein Uhen Architects | 640,751 |
| 96 | Commonwealth Architects | 599,591 |
| 97 | Hastings+Chivetta Architects | 491,188 |
| 98 | DesignGroup | 433,190 |
| 99 | Baskervill | 391,276 |
| 100 | Payette | 383,755 |
| 101 | Taylor Design | 372,052 |
| 102 | LawKingdon Architecture | 350,000 |
| 103 | Anderson Mikos Architects | 350,000 |
| 104 | NAC|Architecture | 345,476 |
| 105 | Environetics | 341,475 |
| 106 | Kirksey | 323,571 |
| 107 | H3 Hardy Collaboration Architecture | 305,903 |
| 108 | Hnedak Bobo Group | 301,000 |
| 109 | TEG Architects | 235,686 |
| 110 | RBB Architects | 215,897 |
| 111 | BBS Architects | 200,030 |
| 112 | DLA Architects | 133,140 |
| 113 | Fanning/Howey Associates | 50,000 |
| 114 | BSA LifeStructures | 41,019 |
| 115 | ai Design Group | 33,048 |
Top Government Sector Engineering Firms
| Rank | Company | 2013 Government Revenue |
| 1 | Fluor Corporation | $2,675,202,710 |
| 2 | URS Corp. | 648,982,536 |
| 3 | AECOM Technology Corp. | 574,020,000 |
| 4 | Jacobs | 287,190,693 |
| 5 | STV | 168,948,000 |
| 6 | Burns & McDonnell | 99,462,332 |
| 7 | Parsons Brinckerhoff | 57,994,366 |
| 8 | Leidos | 55,125,000 |
| 9 | H&A Architects & Engineers | 38,735,000 |
| 10 | Allen & Shariff | 33,964,317 |
| 11 | Dewberry | 26,388,476 |
| 12 | Arup | 23,554,256 |
| 13 | Smith Seckman Reid | 19,741,666 |
| 14 | Simpson Gumpertz & Heger | 19,066,000 |
| 15 | Affiliated Engineers | 15,598,000 |
| 16 | Syska Hennessy Group | 12,155,407 |
| 17 | Thornton Tomasetti | 10,996,123 |
| 18 | Coffman Engineers | 10,676,374 |
| 19 | KPFF Consulting Engineers | 10,500,000 |
| 20 | RMF Engineering | 10,000,000 |
| 21 | Guernsey | 9,680,758 |
| 22 | Shive-Hattery | 9,029,738 |
| 23 | Walker Parking Consultants | 8,925,000 |
| 24 | Bridgers & Paxton Consulting Engineers | 8,780,161 |
| 25 | WSP Group | 8,060,000 |
| 26 | Interface Engineering | 6,809,917 |
| 27 | Glumac | 6,650,738 |
| 28 | Joseph R. Loring & Associates | 6,500,000 |
| 29 | Wiss, Janney, Elstner Associates | 5,870,000 |
| 30 | TTG | 5,811,850 |
| 31 | Graef | 5,387,348 |
| 32 | KJWW Engineering Consultants | 5,191,493 |
| 33 | TLC Engineering for Architecture | 5,134,526 |
| 34 | Heapy Engineering | 5,072,001 |
| 35 | Ross & Baruzzini | 4,975,183 |
| 36 | I. C. Thomasson Associates | 4,750,000 |
| 37 | KCI Technologies | 4,600,000 |
| 38 | Vanderweil Engineers | 4,565,800 |
| 39 | Degenkolb Engineers | 4,462,450 |
| 40 | GRW | 3,753,047 |
| 41 | Sparling | 3,690,424 |
| 42 | H.F. Lenz | 3,559,848 |
| 43 | Barge Waggoner Sumner & Cannon | 3,495,000 |
| 44 | SSOE Group | 3,332,408 |
| 45 | Newcomb & Boyd | 3,140,130 |
| 46 | M/E Engineering | 3,096,775 |
| 47 | Henderson Engineers | 2,989,363 |
| 48 | RDK Engineers | 2,880,000 |
| 49 | Apogee Consulting Group | 2,732,049 |
| 50 | Spectrum Engineers | 2,497,641 |
| 51 | Brinjac Engineering | 2,083,384 |
| 52 | M-E Engineers | 2,000,000 |
| 53 | Davis, Bowen & Friedel | 1,610,242 |
| 54 | Walter P Moore and Associates | 1,441,663 |
| 55 | Rist-Frost-Shumway Engineering | 1,350,000 |
| 56 | CTLGroup | 1,330,000 |
| 57 | GHT Limited | 1,300,000 |
| 58 | French & Parrello Associates | 1,213,200 |
| 59 | Dunham Associates | 1,200,000 |
| 60 | AKF Group | 1,186,000 |
| 61 | Highland Associates | 1,150,000 |
| 62 | Paulus, Sokolowski and Sartor | 1,015,000 |
| 63 | Environmental Systems Design | 920,969 |
| 64 | BR+A Consulting Engineers | 920,000 |
| 65 | Aon Fire Protection Engineering Corp. | 918,914 |
| 66 | CJL Engineering | 870,000 |
| 67 | Mazzetti | 831,363 |
| 68 | Primera Engineers | 775,000 |
| 69 | ThermalTech Engineering | 750,000 |
| 70 | KLH Engineers | 480,951 |
| 71 | OLA Consulting Engineers | 262,000 |
| 72 | Zak Companies | 208,120 |
| 73 | Wick Fisher White | 195,530 |
| 74 | Wallace Engineering | 150,000 |
| 75 | Total Building Commissioning | 122,935 |
| 76 | G&W Engineering Corp. | 109,200 |
| 77 | P2S Engineering | 99,369 |
| 78 | DeSimone Consulting Engineers | 90,000 |
| 79 | Stanley Consultants | 74,747 |
| 80 | Integrated Design Group | 55,650 |
Top Government Sector Construction Firms
| Rank | Company | 2013 Government Revenue |
| 1 | Turner Construction | $2,343,544,729 |
| 2 | Clark Group | 2,342,085,755 |
| 3 | PCL Construction | 1,343,431,142 |
| 4 | Walsh Group, The | 1,188,110,497 |
| 5 | Hensel Phelps | 1,184,760,000 |
| 6 | Balfour Beatty US | 1,145,573,619 |
| 7 | Gilbane | 814,257,000 |
| 8 | Tutor Perini Corp. | 767,580,319 |
| 9 | McCarthy Holdings | 738,000,000 |
| 10 | Lend Lease | 551,622,000 |
| 11 | Skanska USA | 493,318,641 |
| 12 | Whiting-Turner Contracting Co., The | 455,618,872 |
| 13 | Brasfield & Gorrie | 379,267,063 |
| 14 | JE Dunn Construction | 321,764,977 |
| 15 | Hunt Construction Group | 277,300,000 |
| 16 | Mortenson Construction | 178,340,000 |
| 17 | STV | 168,948,000 |
| 18 | Hunt Companies | 154,387,811 |
| 19 | Sundt Construction | 153,006,199 |
| 20 | HITT Contracting | 145,900,000 |
| 21 | O'Neil Industries/W.E. O'Neil | 142,005,318 |
| 22 | CORE Construction Group | 135,900,848 |
| 23 | Manhattan Construction | 126,300,000 |
| 24 | Heery International | 125,058,364 |
| 25 | W. M. Jordan Company | 117,481,667 |
| 26 | Yates Companies, The | 111,200,000 |
| 27 | Holder Construction | 110,063,000 |
| 28 | Flintco | 106,026,635 |
| 29 | Hoffman Construction | 84,474,600 |
| 30 | Messer Construction | 79,799,220 |
| 31 | B. L. Harbert International | 74,365,423 |
| 32 | Consigli Construction | 74,312,383 |
| 33 | James G. Davis Construction | 72,010,706 |
| 34 | Suffolk Construction | 67,717,700 |
| 35 | DPR Construction | 65,709,181 |
| 36 | Coakley & Williams Construction | 61,953,906 |
| 37 | C.W. Driver | 58,850,000 |
| 38 | Parsons Brinckerhoff | 57,994,366 |
| 39 | Ryan Companies US | 57,693,535 |
| 40 | Fortis Construction | 52,585,000 |
| 41 | Shawmut Design and Construction | 49,000,000 |
| 42 | Leopardo Companies | 47,786,003 |
| 43 | Bernards | 46,000,000 |
| 44 | Swinerton Builders | 45,394,000 |
| 45 | Walbridge | 41,300,000 |
| 46 | Hill International | 41,000,000 |
| 47 | Power Construction | 39,000,000 |
| 48 | Kitchell Corp. | 38,162,513 |
| 49 | KBE Building Corp. | 37,661,458 |
| 50 | Beck Group, The | 36,300,176 |
| 51 | Allen & Shariff | 33,964,317 |
| 52 | Barton Malow | 33,108,673 |
| 53 | Wight & Company | 32,543,000 |
| 54 | Haselden Construction | 32,300,743 |
| 55 | Absher Construction | 31,202,850 |
| 56 | Structure Tone | 29,981,000 |
| 57 | Hoar Construction | 29,474,000 |
| 58 | Hathaway Dinwiddie Construction | 29,000,000 |
| 59 | New South Construction | 28,999,000 |
| 60 | Haskell | 28,573,183 |
| 61 | S. M. Wilson & Co. | 28,521,558 |
| 62 | Robins & Morton | 28,415,079 |
| 63 | Harkins Builders | 28,400,000 |
| 64 | EMJ Corp. | 21,000,000 |
| 65 | LeChase Construction Services | 19,680,000 |
| 66 | Bomel Construction | 19,327,000 |
| 67 | Layton Construction | 17,900,000 |
| 68 | Adolfson & Peterson Construction | 17,884,760 |
| 69 | McShane Companies, The | 17,672,043 |
| 70 | BlueScope Construction | 14,554,879 |
| 71 | Juneau Construction | 11,405,546 |
| 72 | Hill & Wilkinson | 10,864,000 |
| 73 | E.W. Howell | 9,541,000 |
| 74 | James McHugh Construction | 8,334,048 |
| 75 | Choate Construction | 7,670,062 |
| 76 | Weitz Company, The | 6,600,000 |
| 77 | JLL | 6,000,000 |
| 78 | Stalco Construction | 5,620,500 |
| 79 | LPCiminelli | 4,790,613 |
| 80 | Kraus-Anderson Construction | 3,000,000 |
| 81 | Bette Companies, The | 2,697,000 |
| 82 | Astorino | 2,384,468 |
| 83 | Batson-Cook | 1,390,120 |
| 84 | Graycor | 1,152,668 |
| 85 | Alberici Constructors | 1,080,320 |
| 86 | Paric Corp. | 1,000,000 |
| 87 | IMC Construction | 75,000 |
Read BD+C's full 2014 Giants 300 Report
Related Stories

| Feb 18, 2014
Study: 90% of healthcare providers say Affordable Care Act is 'step forward,' but major revisions needed
Providers are excited about opportunities to address long-term health issues in the U.S., but worries about the transition persist, according to a new study by Mortenson Construction.

| Feb 17, 2014
SmithGroupJJR President and CEO Carl Roehling appointed to serve on the AIA/AGC Joint Committee
Carl Roehling, FAIA, LEED AP BD+C, president & CEO of SmithGroupJJR, has been appointed to serve on the Joint Committee of The American Institute of Architects (AIA) and The Associated General Contractors of America (AGC).

| Feb 17, 2014
Developer plans to 'crowdfund' extended stay hotel in Manhattan
Want to own a piece of Manhattan hotel real estate? Developer Rodrigo Nino is inviting individual investors to put up $100,000 each for his latest project, 17 John.
| Feb 17, 2014
Call for Entries: 17th annual Building Team Awards - Deadline Extended!
BD+C's Building Team Awards is the industry's only recognition program to honor projects that achieve excellence in both design/construction and collaboration of the AEC/O team. The deadline has been extended to March 14, 2014.
| Feb 17, 2014
GBI to Offer AIA Approved Course Free for 60 Days to Train New Green Globes Professionals
The Green Building Initiative™ (GBI) announced today that between Feb. 13 and April 15 it will provide free access to its online certification course for Green Globes Professionals™ (GGPs). GGPs help guide building projects in achieving Green Globes® ratings, awarded for environmentally-focused design and construction.

| Feb 14, 2014
ASHRAE, Green Grid team up on energy-efficiency guide for data centers
Vendor-neutral publication examines aspects of the popular power usage effectiveness (PUE) metric.
 with")
| Feb 14, 2014
Scrap tires used to boost masonry blocks at Missouri University of S&T
Research could lead to blocks that use waste material and have seismic and insulating benefits.

| Feb 14, 2014
Giant interactive pinwheel adds fun to museum exterior
The proposed design for the Santa Cruz Museum of Art and History features a 10-foot pinwheel that can be activated by passersby.

| Feb 14, 2014
First look: Kentucky's Rupp Arena to get re-clad as part of $310M makeover
Rupp Arena will get a 40-foot high glass façade and a new concourse, but will retain many of its iconic design elements.
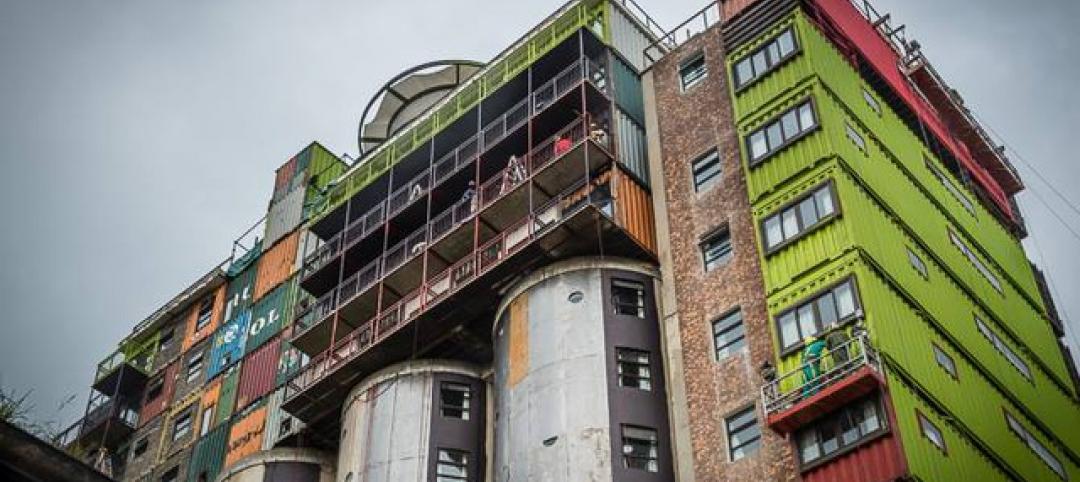
| Feb 14, 2014
Must see: Developer stacks shipping containers atop grain silos to create student housing tower
Mill Junction will house up to 370 students and is supported by 50-year-old grain silos.


