

 Regional Transportation Intermodal Center is a project of the cit")
Federal, state, and local government construction hasn’t exactly been a steamroller for the past few years, due to the end of stimulus availability and the ongoing effects of budget sequestration.
At press time, the most recent Commerce Department report indicated that government construction spending was up just under 1% in April, to a seasonally adjusted annual rate of $267 billion, despite overall economic contraction of about 1% in the first quarter. Federal construction spending was the growth leader, rising by 1.9% to a rate of $23.5 billion. State and local projects—a much larger piece of the public pie—were up just 0.7%, to $243.5 billion.
Among non-infrastructure public construction spending categories, healthcare (up 6%) and education (up 2%) appear most promising for this year, according to the Associated Builders and Contractors’ 2014 forecast.
Improving energy performance of existing properties through targeted upgrades—and, sometimes, large-scale reconstruction—continues to be a federal priority. Of 20 projects recently honored by the General Services Administration’s Design Awards program, half were reconstruction jobs, ranging from Beaux Arts courthouses to Modernist offices.
Along with the push for energy efficiency, federal agencies are increasingly exploring telework as an alternative to expanding office space. The bright side? Telecom and AV renovations will be required to help agencies keep off-site staff connected.
Many state and local governments continue to struggle with the sluggish overall economy, causing delays in needed construction. Among the discernible themes among state and local projects submitted to BD+C: new police facilities (designed to reflect changing ideas about community policing), replacement and upgraded courthouses, and mass-transit stations.
Top Government Sector Architecture Firms
| Rank | Company | 2013 Government Revenue |
| 1 | Stantec | $144,299,056 |
| 2 | Heery International | 125,058,364 |
| 3 | HOK | 114,753,666 |
| 4 | SmithGroupJJR | 83,064,158 |
| 5 | HDR | 81,601,164 |
| 6 | Skidmore, Owings & Merrill | 57,835,664 |
| 7 | SHW Group | 56,007,000 |
| 8 | Gensler | 52,272,600 |
| 9 | EYP Architecture & Engineering | 42,800,000 |
| 10 | RS&H | 39,200,000 |
| 11 | Page | 38,704,000 |
| 12 | Moseley Architects | 35,135,469 |
| 13 | Leo A Daly | 29,483,542 |
| 14 | Perkins+will | 28,975,375 |
| 15 | Clark Nexsen | 28,873,388 |
| 16 | ZGF Architects | 27,425,548 |
| 17 | CannonDesign | 27,000,000 |
| 18 | FreemanWhite | 25,941,154 |
| 19 | NBBJ | 19,382,000 |
| 20 | DLR Group | 19,300,000 |
| 21 | Hammel, Green and Abrahamson | 19,167,839 |
| 22 | EwingCole | 17,300,000 |
| 23 | HKS | 17,247,862 |
| 24 | PGAL | 16,097,917 |
| 25 | HNTB Corp. | 15,269,498 |
| 26 | Westlake Reed Leskosky | 15,049,000 |
| 27 | Quattrocchi Kwok Architects | 13,230,000 |
| 28 | Hoefer Wysocki Architecture | 12,860,000 |
| 29 | Fentress Architects | 12,160,971 |
| 30 | BLDD Architects | 11,800,000 |
| 31 | RTKL Associates | 11,469,000 |
| 32 | SchenkelShultz Architecture | 11,278,000 |
| 33 | NORR | 9,792,248 |
| 34 | LS3P | 8,882,375 |
| 35 | Morris Architects | 8,350,000 |
| 36 | Davis Brody Bond | 8,263,108 |
| 37 | LaBella Associates | 8,130,000 |
| 38 | CTA Architects Engineers | 8,014,884 |
| 39 | Beyer Blinder Belle | 7,947,688 |
| 40 | HMC Architects | 6,811,005 |
| 41 | VOA Associates | 6,808,200 |
| 42 | Parkhill, Smith & Cooper | 6,687,000 |
| 43 | Rosser International | 6,652,324 |
| 44 | LMN Architects | 6,388,100 |
| 45 | Sherlock, Smith & Adams | 6,388,000 |
| 46 | Becker Morgan Group | 6,343,277 |
| 47 | Flad Architects | 6,126,870 |
| 48 | KZF Design | 5,887,462 |
| 49 | Epstein | 5,402,000 |
| 50 | IBI Group ? Gruzen Samton | 5,000,000 |
| 51 | Solomon Cordwell Buenz | 4,500,000 |
| 52 | Goodwyn Mills & Cawood | 4,409,249 |
| 53 | Wight & Company | 4,402,093 |
| 54 | RSP Architects | 4,326,000 |
| 55 | Harley Ellis Devereaux | 4,310,000 |
| 56 | Carrier Johnson + Culture | 4,066,891 |
| 57 | BRPH | 3,957,000 |
| 58 | FGM Architects | 3,776,698 |
| 59 | Ennead Architects | 3,729,000 |
| 60 | RNL | 3,418,000 |
| 61 | WDG Architecture | 3,095,000 |
| 62 | Perkins Eastman | 3,000,000 |
| 63 | GWWO | 2,965,804 |
| 64 | Gresham, Smith and Partners | 2,787,930 |
| 65 | Integrus Architecture | 2,705,119 |
| 66 | Hoffmann Architects | 2,654,000 |
| 67 | Swanke Hayden Connell Architects | 2,534,000 |
| 68 | Ratio Architects | 2,462,355 |
| 69 | LPA | 2,205,538 |
| 70 | Emersion Design | 2,183,039 |
| 71 | Array Architects | 2,138,000 |
| 72 | WHR Architects | 2,076,445 |
| 73 | Cooper Carry | 1,987,669 |
| 74 | Little | 1,961,000 |
| 75 | Bergmann Associates | 1,941,360 |
| 76 | OZ Architecture | 1,724,680 |
| 77 | Legat Architects | 1,675,500 |
| 78 | LBL Architects | 1,600,000 |
| 79 | Schrader Group Architecture | 1,573,559 |
| 80 | Symmes Maini & McKee Associates | 1,563,000 |
| 81 | Good Fulton & Farrell | 1,373,500 |
| 82 | H+L Architecture | 1,295,496 |
| 83 | Harvard Jolly Architecture | 1,221,576 |
| 84 | Cambridge Seven Associates | 1,210,000 |
| 85 | FXFOWLE Architects | 1,180,000 |
| 86 | Smallwood, Reynolds, Stewart, Stewart & Associates | 1,128,560 |
| 87 | Moody Nolan | 1,083,924 |
| 88 | CO Architects | 1,031,600 |
| 89 | Shepley Bulfinch | 836,000 |
| 90 | Corgan | 762,894 |
| 91 | Cuningham Group Architecture | 742,891 |
| 92 | Lord Aeck Sargent | 742,273 |
| 93 | GBBN Architects | 660,000 |
| 94 | Nadel | 650,000 |
| 95 | Eppstein Uhen Architects | 640,751 |
| 96 | Commonwealth Architects | 599,591 |
| 97 | Hastings+Chivetta Architects | 491,188 |
| 98 | DesignGroup | 433,190 |
| 99 | Baskervill | 391,276 |
| 100 | Payette | 383,755 |
| 101 | Taylor Design | 372,052 |
| 102 | LawKingdon Architecture | 350,000 |
| 103 | Anderson Mikos Architects | 350,000 |
| 104 | NAC|Architecture | 345,476 |
| 105 | Environetics | 341,475 |
| 106 | Kirksey | 323,571 |
| 107 | H3 Hardy Collaboration Architecture | 305,903 |
| 108 | Hnedak Bobo Group | 301,000 |
| 109 | TEG Architects | 235,686 |
| 110 | RBB Architects | 215,897 |
| 111 | BBS Architects | 200,030 |
| 112 | DLA Architects | 133,140 |
| 113 | Fanning/Howey Associates | 50,000 |
| 114 | BSA LifeStructures | 41,019 |
| 115 | ai Design Group | 33,048 |
Top Government Sector Engineering Firms
| Rank | Company | 2013 Government Revenue |
| 1 | Fluor Corporation | $2,675,202,710 |
| 2 | URS Corp. | 648,982,536 |
| 3 | AECOM Technology Corp. | 574,020,000 |
| 4 | Jacobs | 287,190,693 |
| 5 | STV | 168,948,000 |
| 6 | Burns & McDonnell | 99,462,332 |
| 7 | Parsons Brinckerhoff | 57,994,366 |
| 8 | Leidos | 55,125,000 |
| 9 | H&A Architects & Engineers | 38,735,000 |
| 10 | Allen & Shariff | 33,964,317 |
| 11 | Dewberry | 26,388,476 |
| 12 | Arup | 23,554,256 |
| 13 | Smith Seckman Reid | 19,741,666 |
| 14 | Simpson Gumpertz & Heger | 19,066,000 |
| 15 | Affiliated Engineers | 15,598,000 |
| 16 | Syska Hennessy Group | 12,155,407 |
| 17 | Thornton Tomasetti | 10,996,123 |
| 18 | Coffman Engineers | 10,676,374 |
| 19 | KPFF Consulting Engineers | 10,500,000 |
| 20 | RMF Engineering | 10,000,000 |
| 21 | Guernsey | 9,680,758 |
| 22 | Shive-Hattery | 9,029,738 |
| 23 | Walker Parking Consultants | 8,925,000 |
| 24 | Bridgers & Paxton Consulting Engineers | 8,780,161 |
| 25 | WSP Group | 8,060,000 |
| 26 | Interface Engineering | 6,809,917 |
| 27 | Glumac | 6,650,738 |
| 28 | Joseph R. Loring & Associates | 6,500,000 |
| 29 | Wiss, Janney, Elstner Associates | 5,870,000 |
| 30 | TTG | 5,811,850 |
| 31 | Graef | 5,387,348 |
| 32 | KJWW Engineering Consultants | 5,191,493 |
| 33 | TLC Engineering for Architecture | 5,134,526 |
| 34 | Heapy Engineering | 5,072,001 |
| 35 | Ross & Baruzzini | 4,975,183 |
| 36 | I. C. Thomasson Associates | 4,750,000 |
| 37 | KCI Technologies | 4,600,000 |
| 38 | Vanderweil Engineers | 4,565,800 |
| 39 | Degenkolb Engineers | 4,462,450 |
| 40 | GRW | 3,753,047 |
| 41 | Sparling | 3,690,424 |
| 42 | H.F. Lenz | 3,559,848 |
| 43 | Barge Waggoner Sumner & Cannon | 3,495,000 |
| 44 | SSOE Group | 3,332,408 |
| 45 | Newcomb & Boyd | 3,140,130 |
| 46 | M/E Engineering | 3,096,775 |
| 47 | Henderson Engineers | 2,989,363 |
| 48 | RDK Engineers | 2,880,000 |
| 49 | Apogee Consulting Group | 2,732,049 |
| 50 | Spectrum Engineers | 2,497,641 |
| 51 | Brinjac Engineering | 2,083,384 |
| 52 | M-E Engineers | 2,000,000 |
| 53 | Davis, Bowen & Friedel | 1,610,242 |
| 54 | Walter P Moore and Associates | 1,441,663 |
| 55 | Rist-Frost-Shumway Engineering | 1,350,000 |
| 56 | CTLGroup | 1,330,000 |
| 57 | GHT Limited | 1,300,000 |
| 58 | French & Parrello Associates | 1,213,200 |
| 59 | Dunham Associates | 1,200,000 |
| 60 | AKF Group | 1,186,000 |
| 61 | Highland Associates | 1,150,000 |
| 62 | Paulus, Sokolowski and Sartor | 1,015,000 |
| 63 | Environmental Systems Design | 920,969 |
| 64 | BR+A Consulting Engineers | 920,000 |
| 65 | Aon Fire Protection Engineering Corp. | 918,914 |
| 66 | CJL Engineering | 870,000 |
| 67 | Mazzetti | 831,363 |
| 68 | Primera Engineers | 775,000 |
| 69 | ThermalTech Engineering | 750,000 |
| 70 | KLH Engineers | 480,951 |
| 71 | OLA Consulting Engineers | 262,000 |
| 72 | Zak Companies | 208,120 |
| 73 | Wick Fisher White | 195,530 |
| 74 | Wallace Engineering | 150,000 |
| 75 | Total Building Commissioning | 122,935 |
| 76 | G&W Engineering Corp. | 109,200 |
| 77 | P2S Engineering | 99,369 |
| 78 | DeSimone Consulting Engineers | 90,000 |
| 79 | Stanley Consultants | 74,747 |
| 80 | Integrated Design Group | 55,650 |
Top Government Sector Construction Firms
| Rank | Company | 2013 Government Revenue |
| 1 | Turner Construction | $2,343,544,729 |
| 2 | Clark Group | 2,342,085,755 |
| 3 | PCL Construction | 1,343,431,142 |
| 4 | Walsh Group, The | 1,188,110,497 |
| 5 | Hensel Phelps | 1,184,760,000 |
| 6 | Balfour Beatty US | 1,145,573,619 |
| 7 | Gilbane | 814,257,000 |
| 8 | Tutor Perini Corp. | 767,580,319 |
| 9 | McCarthy Holdings | 738,000,000 |
| 10 | Lend Lease | 551,622,000 |
| 11 | Skanska USA | 493,318,641 |
| 12 | Whiting-Turner Contracting Co., The | 455,618,872 |
| 13 | Brasfield & Gorrie | 379,267,063 |
| 14 | JE Dunn Construction | 321,764,977 |
| 15 | Hunt Construction Group | 277,300,000 |
| 16 | Mortenson Construction | 178,340,000 |
| 17 | STV | 168,948,000 |
| 18 | Hunt Companies | 154,387,811 |
| 19 | Sundt Construction | 153,006,199 |
| 20 | HITT Contracting | 145,900,000 |
| 21 | O'Neil Industries/W.E. O'Neil | 142,005,318 |
| 22 | CORE Construction Group | 135,900,848 |
| 23 | Manhattan Construction | 126,300,000 |
| 24 | Heery International | 125,058,364 |
| 25 | W. M. Jordan Company | 117,481,667 |
| 26 | Yates Companies, The | 111,200,000 |
| 27 | Holder Construction | 110,063,000 |
| 28 | Flintco | 106,026,635 |
| 29 | Hoffman Construction | 84,474,600 |
| 30 | Messer Construction | 79,799,220 |
| 31 | B. L. Harbert International | 74,365,423 |
| 32 | Consigli Construction | 74,312,383 |
| 33 | James G. Davis Construction | 72,010,706 |
| 34 | Suffolk Construction | 67,717,700 |
| 35 | DPR Construction | 65,709,181 |
| 36 | Coakley & Williams Construction | 61,953,906 |
| 37 | C.W. Driver | 58,850,000 |
| 38 | Parsons Brinckerhoff | 57,994,366 |
| 39 | Ryan Companies US | 57,693,535 |
| 40 | Fortis Construction | 52,585,000 |
| 41 | Shawmut Design and Construction | 49,000,000 |
| 42 | Leopardo Companies | 47,786,003 |
| 43 | Bernards | 46,000,000 |
| 44 | Swinerton Builders | 45,394,000 |
| 45 | Walbridge | 41,300,000 |
| 46 | Hill International | 41,000,000 |
| 47 | Power Construction | 39,000,000 |
| 48 | Kitchell Corp. | 38,162,513 |
| 49 | KBE Building Corp. | 37,661,458 |
| 50 | Beck Group, The | 36,300,176 |
| 51 | Allen & Shariff | 33,964,317 |
| 52 | Barton Malow | 33,108,673 |
| 53 | Wight & Company | 32,543,000 |
| 54 | Haselden Construction | 32,300,743 |
| 55 | Absher Construction | 31,202,850 |
| 56 | Structure Tone | 29,981,000 |
| 57 | Hoar Construction | 29,474,000 |
| 58 | Hathaway Dinwiddie Construction | 29,000,000 |
| 59 | New South Construction | 28,999,000 |
| 60 | Haskell | 28,573,183 |
| 61 | S. M. Wilson & Co. | 28,521,558 |
| 62 | Robins & Morton | 28,415,079 |
| 63 | Harkins Builders | 28,400,000 |
| 64 | EMJ Corp. | 21,000,000 |
| 65 | LeChase Construction Services | 19,680,000 |
| 66 | Bomel Construction | 19,327,000 |
| 67 | Layton Construction | 17,900,000 |
| 68 | Adolfson & Peterson Construction | 17,884,760 |
| 69 | McShane Companies, The | 17,672,043 |
| 70 | BlueScope Construction | 14,554,879 |
| 71 | Juneau Construction | 11,405,546 |
| 72 | Hill & Wilkinson | 10,864,000 |
| 73 | E.W. Howell | 9,541,000 |
| 74 | James McHugh Construction | 8,334,048 |
| 75 | Choate Construction | 7,670,062 |
| 76 | Weitz Company, The | 6,600,000 |
| 77 | JLL | 6,000,000 |
| 78 | Stalco Construction | 5,620,500 |
| 79 | LPCiminelli | 4,790,613 |
| 80 | Kraus-Anderson Construction | 3,000,000 |
| 81 | Bette Companies, The | 2,697,000 |
| 82 | Astorino | 2,384,468 |
| 83 | Batson-Cook | 1,390,120 |
| 84 | Graycor | 1,152,668 |
| 85 | Alberici Constructors | 1,080,320 |
| 86 | Paric Corp. | 1,000,000 |
| 87 | IMC Construction | 75,000 |
Read BD+C's full 2014 Giants 300 Report
Related Stories

| Nov 27, 2013
Wonder walls: 13 choices for the building envelope
BD+C editors present a roundup of the latest technologies and applications in exterior wall systems, from a tapered metal wall installation in Oklahoma to a textured precast concrete solution in North Carolina.

| Nov 27, 2013
University reconstruction projects: The 5 keys to success
This AIA CES Discovery course discusses the environmental, economic, and market pressures affecting facility planning for universities and colleges, and outlines current approaches to renovations for critical academic spaces.

| Nov 26, 2013
7 ways to make your firm more successful
Like all professional services businesses, AEC firms are challenged to effectively manage people. And even though people can be rather unpredictable, a firm’s success doesn’t have to be. Here are seven ways to make your firm more successful in the face of market variability and uncertainty.

| Nov 26, 2013
Design-build downsized: Applying the design-build method in an era of smaller projects
Any project can benefit from the collaborative spirit and cooperative relationships embodied by design-build. But is there a point of diminishing return where the design-build project delivery model just doesn't make sense for small projects? Design-build expert Lisa Cooley debates the issue.

| Nov 25, 2013
Electronic plan review: Coming soon to a city near you?
With all the effort AEC professionals put into leveraging technology to communicate digitally on projects, it is a shame that there is often one major road block that becomes the paper in their otherwise “paperless” project: the local city planning and permitting department.
| Nov 22, 2013
Kieran Timberlake, PE International develop BIM tool for green building life cycle assessment
Kieran Timberlake and PE International have developed Tally, an analysis tool to help BIM users keep better score of their projects’ complete environmental footprints.

| Nov 20, 2013
Architecture Billings Index slows in October; project inquiries stay strong
Following three months of accelerating demand for design services, the Architecture Billings Index reflected a somewhat slower pace of growth in October. The October ABI score was 51.6, down from a mark of 54.3 in September.
| Nov 19, 2013
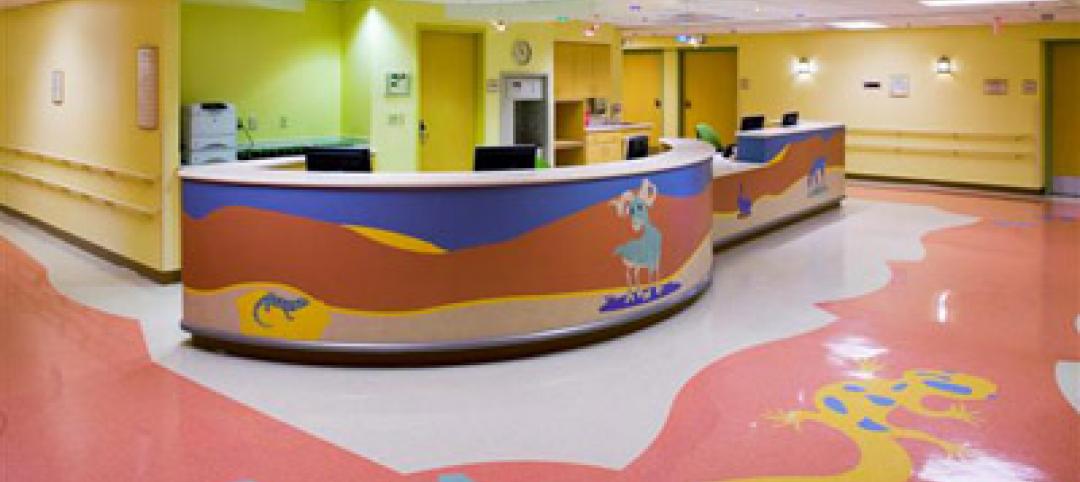
Pediatric design in an adult hospital setting
Freestanding pediatric facilities have operational and physical characteristics that differ from those of adult facilities.

| Nov 18, 2013
6 checkpoints when designing a pediatric healthcare unit
As more time and money is devoted to neonatal and pediatric research, evidence-based design is playing an increasingly crucial role in the development of healthcare facilities for children. Here are six important factors AEC firms should consider when designing pediatric healthcare facilities.

| Nov 18, 2013
Lord Aeck Sargent opens metro D.C. office, updates brand
Architecture, design, and planning firm unveils its sixth office, plus a new visual identity system and website


