

 Regional Transportation Intermodal Center is a project of the cit")
Federal, state, and local government construction hasn’t exactly been a steamroller for the past few years, due to the end of stimulus availability and the ongoing effects of budget sequestration.
At press time, the most recent Commerce Department report indicated that government construction spending was up just under 1% in April, to a seasonally adjusted annual rate of $267 billion, despite overall economic contraction of about 1% in the first quarter. Federal construction spending was the growth leader, rising by 1.9% to a rate of $23.5 billion. State and local projects—a much larger piece of the public pie—were up just 0.7%, to $243.5 billion.
Among non-infrastructure public construction spending categories, healthcare (up 6%) and education (up 2%) appear most promising for this year, according to the Associated Builders and Contractors’ 2014 forecast.
Improving energy performance of existing properties through targeted upgrades—and, sometimes, large-scale reconstruction—continues to be a federal priority. Of 20 projects recently honored by the General Services Administration’s Design Awards program, half were reconstruction jobs, ranging from Beaux Arts courthouses to Modernist offices.
Along with the push for energy efficiency, federal agencies are increasingly exploring telework as an alternative to expanding office space. The bright side? Telecom and AV renovations will be required to help agencies keep off-site staff connected.
Many state and local governments continue to struggle with the sluggish overall economy, causing delays in needed construction. Among the discernible themes among state and local projects submitted to BD+C: new police facilities (designed to reflect changing ideas about community policing), replacement and upgraded courthouses, and mass-transit stations.
Top Government Sector Architecture Firms
| Rank | Company | 2013 Government Revenue |
| 1 | Stantec | $144,299,056 |
| 2 | Heery International | 125,058,364 |
| 3 | HOK | 114,753,666 |
| 4 | SmithGroupJJR | 83,064,158 |
| 5 | HDR | 81,601,164 |
| 6 | Skidmore, Owings & Merrill | 57,835,664 |
| 7 | SHW Group | 56,007,000 |
| 8 | Gensler | 52,272,600 |
| 9 | EYP Architecture & Engineering | 42,800,000 |
| 10 | RS&H | 39,200,000 |
| 11 | Page | 38,704,000 |
| 12 | Moseley Architects | 35,135,469 |
| 13 | Leo A Daly | 29,483,542 |
| 14 | Perkins+will | 28,975,375 |
| 15 | Clark Nexsen | 28,873,388 |
| 16 | ZGF Architects | 27,425,548 |
| 17 | CannonDesign | 27,000,000 |
| 18 | FreemanWhite | 25,941,154 |
| 19 | NBBJ | 19,382,000 |
| 20 | DLR Group | 19,300,000 |
| 21 | Hammel, Green and Abrahamson | 19,167,839 |
| 22 | EwingCole | 17,300,000 |
| 23 | HKS | 17,247,862 |
| 24 | PGAL | 16,097,917 |
| 25 | HNTB Corp. | 15,269,498 |
| 26 | Westlake Reed Leskosky | 15,049,000 |
| 27 | Quattrocchi Kwok Architects | 13,230,000 |
| 28 | Hoefer Wysocki Architecture | 12,860,000 |
| 29 | Fentress Architects | 12,160,971 |
| 30 | BLDD Architects | 11,800,000 |
| 31 | RTKL Associates | 11,469,000 |
| 32 | SchenkelShultz Architecture | 11,278,000 |
| 33 | NORR | 9,792,248 |
| 34 | LS3P | 8,882,375 |
| 35 | Morris Architects | 8,350,000 |
| 36 | Davis Brody Bond | 8,263,108 |
| 37 | LaBella Associates | 8,130,000 |
| 38 | CTA Architects Engineers | 8,014,884 |
| 39 | Beyer Blinder Belle | 7,947,688 |
| 40 | HMC Architects | 6,811,005 |
| 41 | VOA Associates | 6,808,200 |
| 42 | Parkhill, Smith & Cooper | 6,687,000 |
| 43 | Rosser International | 6,652,324 |
| 44 | LMN Architects | 6,388,100 |
| 45 | Sherlock, Smith & Adams | 6,388,000 |
| 46 | Becker Morgan Group | 6,343,277 |
| 47 | Flad Architects | 6,126,870 |
| 48 | KZF Design | 5,887,462 |
| 49 | Epstein | 5,402,000 |
| 50 | IBI Group ? Gruzen Samton | 5,000,000 |
| 51 | Solomon Cordwell Buenz | 4,500,000 |
| 52 | Goodwyn Mills & Cawood | 4,409,249 |
| 53 | Wight & Company | 4,402,093 |
| 54 | RSP Architects | 4,326,000 |
| 55 | Harley Ellis Devereaux | 4,310,000 |
| 56 | Carrier Johnson + Culture | 4,066,891 |
| 57 | BRPH | 3,957,000 |
| 58 | FGM Architects | 3,776,698 |
| 59 | Ennead Architects | 3,729,000 |
| 60 | RNL | 3,418,000 |
| 61 | WDG Architecture | 3,095,000 |
| 62 | Perkins Eastman | 3,000,000 |
| 63 | GWWO | 2,965,804 |
| 64 | Gresham, Smith and Partners | 2,787,930 |
| 65 | Integrus Architecture | 2,705,119 |
| 66 | Hoffmann Architects | 2,654,000 |
| 67 | Swanke Hayden Connell Architects | 2,534,000 |
| 68 | Ratio Architects | 2,462,355 |
| 69 | LPA | 2,205,538 |
| 70 | Emersion Design | 2,183,039 |
| 71 | Array Architects | 2,138,000 |
| 72 | WHR Architects | 2,076,445 |
| 73 | Cooper Carry | 1,987,669 |
| 74 | Little | 1,961,000 |
| 75 | Bergmann Associates | 1,941,360 |
| 76 | OZ Architecture | 1,724,680 |
| 77 | Legat Architects | 1,675,500 |
| 78 | LBL Architects | 1,600,000 |
| 79 | Schrader Group Architecture | 1,573,559 |
| 80 | Symmes Maini & McKee Associates | 1,563,000 |
| 81 | Good Fulton & Farrell | 1,373,500 |
| 82 | H+L Architecture | 1,295,496 |
| 83 | Harvard Jolly Architecture | 1,221,576 |
| 84 | Cambridge Seven Associates | 1,210,000 |
| 85 | FXFOWLE Architects | 1,180,000 |
| 86 | Smallwood, Reynolds, Stewart, Stewart & Associates | 1,128,560 |
| 87 | Moody Nolan | 1,083,924 |
| 88 | CO Architects | 1,031,600 |
| 89 | Shepley Bulfinch | 836,000 |
| 90 | Corgan | 762,894 |
| 91 | Cuningham Group Architecture | 742,891 |
| 92 | Lord Aeck Sargent | 742,273 |
| 93 | GBBN Architects | 660,000 |
| 94 | Nadel | 650,000 |
| 95 | Eppstein Uhen Architects | 640,751 |
| 96 | Commonwealth Architects | 599,591 |
| 97 | Hastings+Chivetta Architects | 491,188 |
| 98 | DesignGroup | 433,190 |
| 99 | Baskervill | 391,276 |
| 100 | Payette | 383,755 |
| 101 | Taylor Design | 372,052 |
| 102 | LawKingdon Architecture | 350,000 |
| 103 | Anderson Mikos Architects | 350,000 |
| 104 | NAC|Architecture | 345,476 |
| 105 | Environetics | 341,475 |
| 106 | Kirksey | 323,571 |
| 107 | H3 Hardy Collaboration Architecture | 305,903 |
| 108 | Hnedak Bobo Group | 301,000 |
| 109 | TEG Architects | 235,686 |
| 110 | RBB Architects | 215,897 |
| 111 | BBS Architects | 200,030 |
| 112 | DLA Architects | 133,140 |
| 113 | Fanning/Howey Associates | 50,000 |
| 114 | BSA LifeStructures | 41,019 |
| 115 | ai Design Group | 33,048 |
Top Government Sector Engineering Firms
| Rank | Company | 2013 Government Revenue |
| 1 | Fluor Corporation | $2,675,202,710 |
| 2 | URS Corp. | 648,982,536 |
| 3 | AECOM Technology Corp. | 574,020,000 |
| 4 | Jacobs | 287,190,693 |
| 5 | STV | 168,948,000 |
| 6 | Burns & McDonnell | 99,462,332 |
| 7 | Parsons Brinckerhoff | 57,994,366 |
| 8 | Leidos | 55,125,000 |
| 9 | H&A Architects & Engineers | 38,735,000 |
| 10 | Allen & Shariff | 33,964,317 |
| 11 | Dewberry | 26,388,476 |
| 12 | Arup | 23,554,256 |
| 13 | Smith Seckman Reid | 19,741,666 |
| 14 | Simpson Gumpertz & Heger | 19,066,000 |
| 15 | Affiliated Engineers | 15,598,000 |
| 16 | Syska Hennessy Group | 12,155,407 |
| 17 | Thornton Tomasetti | 10,996,123 |
| 18 | Coffman Engineers | 10,676,374 |
| 19 | KPFF Consulting Engineers | 10,500,000 |
| 20 | RMF Engineering | 10,000,000 |
| 21 | Guernsey | 9,680,758 |
| 22 | Shive-Hattery | 9,029,738 |
| 23 | Walker Parking Consultants | 8,925,000 |
| 24 | Bridgers & Paxton Consulting Engineers | 8,780,161 |
| 25 | WSP Group | 8,060,000 |
| 26 | Interface Engineering | 6,809,917 |
| 27 | Glumac | 6,650,738 |
| 28 | Joseph R. Loring & Associates | 6,500,000 |
| 29 | Wiss, Janney, Elstner Associates | 5,870,000 |
| 30 | TTG | 5,811,850 |
| 31 | Graef | 5,387,348 |
| 32 | KJWW Engineering Consultants | 5,191,493 |
| 33 | TLC Engineering for Architecture | 5,134,526 |
| 34 | Heapy Engineering | 5,072,001 |
| 35 | Ross & Baruzzini | 4,975,183 |
| 36 | I. C. Thomasson Associates | 4,750,000 |
| 37 | KCI Technologies | 4,600,000 |
| 38 | Vanderweil Engineers | 4,565,800 |
| 39 | Degenkolb Engineers | 4,462,450 |
| 40 | GRW | 3,753,047 |
| 41 | Sparling | 3,690,424 |
| 42 | H.F. Lenz | 3,559,848 |
| 43 | Barge Waggoner Sumner & Cannon | 3,495,000 |
| 44 | SSOE Group | 3,332,408 |
| 45 | Newcomb & Boyd | 3,140,130 |
| 46 | M/E Engineering | 3,096,775 |
| 47 | Henderson Engineers | 2,989,363 |
| 48 | RDK Engineers | 2,880,000 |
| 49 | Apogee Consulting Group | 2,732,049 |
| 50 | Spectrum Engineers | 2,497,641 |
| 51 | Brinjac Engineering | 2,083,384 |
| 52 | M-E Engineers | 2,000,000 |
| 53 | Davis, Bowen & Friedel | 1,610,242 |
| 54 | Walter P Moore and Associates | 1,441,663 |
| 55 | Rist-Frost-Shumway Engineering | 1,350,000 |
| 56 | CTLGroup | 1,330,000 |
| 57 | GHT Limited | 1,300,000 |
| 58 | French & Parrello Associates | 1,213,200 |
| 59 | Dunham Associates | 1,200,000 |
| 60 | AKF Group | 1,186,000 |
| 61 | Highland Associates | 1,150,000 |
| 62 | Paulus, Sokolowski and Sartor | 1,015,000 |
| 63 | Environmental Systems Design | 920,969 |
| 64 | BR+A Consulting Engineers | 920,000 |
| 65 | Aon Fire Protection Engineering Corp. | 918,914 |
| 66 | CJL Engineering | 870,000 |
| 67 | Mazzetti | 831,363 |
| 68 | Primera Engineers | 775,000 |
| 69 | ThermalTech Engineering | 750,000 |
| 70 | KLH Engineers | 480,951 |
| 71 | OLA Consulting Engineers | 262,000 |
| 72 | Zak Companies | 208,120 |
| 73 | Wick Fisher White | 195,530 |
| 74 | Wallace Engineering | 150,000 |
| 75 | Total Building Commissioning | 122,935 |
| 76 | G&W Engineering Corp. | 109,200 |
| 77 | P2S Engineering | 99,369 |
| 78 | DeSimone Consulting Engineers | 90,000 |
| 79 | Stanley Consultants | 74,747 |
| 80 | Integrated Design Group | 55,650 |
Top Government Sector Construction Firms
| Rank | Company | 2013 Government Revenue |
| 1 | Turner Construction | $2,343,544,729 |
| 2 | Clark Group | 2,342,085,755 |
| 3 | PCL Construction | 1,343,431,142 |
| 4 | Walsh Group, The | 1,188,110,497 |
| 5 | Hensel Phelps | 1,184,760,000 |
| 6 | Balfour Beatty US | 1,145,573,619 |
| 7 | Gilbane | 814,257,000 |
| 8 | Tutor Perini Corp. | 767,580,319 |
| 9 | McCarthy Holdings | 738,000,000 |
| 10 | Lend Lease | 551,622,000 |
| 11 | Skanska USA | 493,318,641 |
| 12 | Whiting-Turner Contracting Co., The | 455,618,872 |
| 13 | Brasfield & Gorrie | 379,267,063 |
| 14 | JE Dunn Construction | 321,764,977 |
| 15 | Hunt Construction Group | 277,300,000 |
| 16 | Mortenson Construction | 178,340,000 |
| 17 | STV | 168,948,000 |
| 18 | Hunt Companies | 154,387,811 |
| 19 | Sundt Construction | 153,006,199 |
| 20 | HITT Contracting | 145,900,000 |
| 21 | O'Neil Industries/W.E. O'Neil | 142,005,318 |
| 22 | CORE Construction Group | 135,900,848 |
| 23 | Manhattan Construction | 126,300,000 |
| 24 | Heery International | 125,058,364 |
| 25 | W. M. Jordan Company | 117,481,667 |
| 26 | Yates Companies, The | 111,200,000 |
| 27 | Holder Construction | 110,063,000 |
| 28 | Flintco | 106,026,635 |
| 29 | Hoffman Construction | 84,474,600 |
| 30 | Messer Construction | 79,799,220 |
| 31 | B. L. Harbert International | 74,365,423 |
| 32 | Consigli Construction | 74,312,383 |
| 33 | James G. Davis Construction | 72,010,706 |
| 34 | Suffolk Construction | 67,717,700 |
| 35 | DPR Construction | 65,709,181 |
| 36 | Coakley & Williams Construction | 61,953,906 |
| 37 | C.W. Driver | 58,850,000 |
| 38 | Parsons Brinckerhoff | 57,994,366 |
| 39 | Ryan Companies US | 57,693,535 |
| 40 | Fortis Construction | 52,585,000 |
| 41 | Shawmut Design and Construction | 49,000,000 |
| 42 | Leopardo Companies | 47,786,003 |
| 43 | Bernards | 46,000,000 |
| 44 | Swinerton Builders | 45,394,000 |
| 45 | Walbridge | 41,300,000 |
| 46 | Hill International | 41,000,000 |
| 47 | Power Construction | 39,000,000 |
| 48 | Kitchell Corp. | 38,162,513 |
| 49 | KBE Building Corp. | 37,661,458 |
| 50 | Beck Group, The | 36,300,176 |
| 51 | Allen & Shariff | 33,964,317 |
| 52 | Barton Malow | 33,108,673 |
| 53 | Wight & Company | 32,543,000 |
| 54 | Haselden Construction | 32,300,743 |
| 55 | Absher Construction | 31,202,850 |
| 56 | Structure Tone | 29,981,000 |
| 57 | Hoar Construction | 29,474,000 |
| 58 | Hathaway Dinwiddie Construction | 29,000,000 |
| 59 | New South Construction | 28,999,000 |
| 60 | Haskell | 28,573,183 |
| 61 | S. M. Wilson & Co. | 28,521,558 |
| 62 | Robins & Morton | 28,415,079 |
| 63 | Harkins Builders | 28,400,000 |
| 64 | EMJ Corp. | 21,000,000 |
| 65 | LeChase Construction Services | 19,680,000 |
| 66 | Bomel Construction | 19,327,000 |
| 67 | Layton Construction | 17,900,000 |
| 68 | Adolfson & Peterson Construction | 17,884,760 |
| 69 | McShane Companies, The | 17,672,043 |
| 70 | BlueScope Construction | 14,554,879 |
| 71 | Juneau Construction | 11,405,546 |
| 72 | Hill & Wilkinson | 10,864,000 |
| 73 | E.W. Howell | 9,541,000 |
| 74 | James McHugh Construction | 8,334,048 |
| 75 | Choate Construction | 7,670,062 |
| 76 | Weitz Company, The | 6,600,000 |
| 77 | JLL | 6,000,000 |
| 78 | Stalco Construction | 5,620,500 |
| 79 | LPCiminelli | 4,790,613 |
| 80 | Kraus-Anderson Construction | 3,000,000 |
| 81 | Bette Companies, The | 2,697,000 |
| 82 | Astorino | 2,384,468 |
| 83 | Batson-Cook | 1,390,120 |
| 84 | Graycor | 1,152,668 |
| 85 | Alberici Constructors | 1,080,320 |
| 86 | Paric Corp. | 1,000,000 |
| 87 | IMC Construction | 75,000 |
Read BD+C's full 2014 Giants 300 Report
Related Stories

| Aug 30, 2013
Local Government Report [2013 Giants 300 Report]
Building Design+Construction's rankings of the nation's largest local government design and construction firms, as reported in the 2013 Giants 300 Report.

| Aug 30, 2013
A new approach to post-occupancy evaluations
As a growing number of healthcare institutions become more customer-focused, post-occupancy evaluations (POE) are playing a bigger role in new construction and renovation projects. Advocate Health Care is among the healthcare organizations to institute a detailed post-occupancy assessment process for its projects.
| Aug 29, 2013
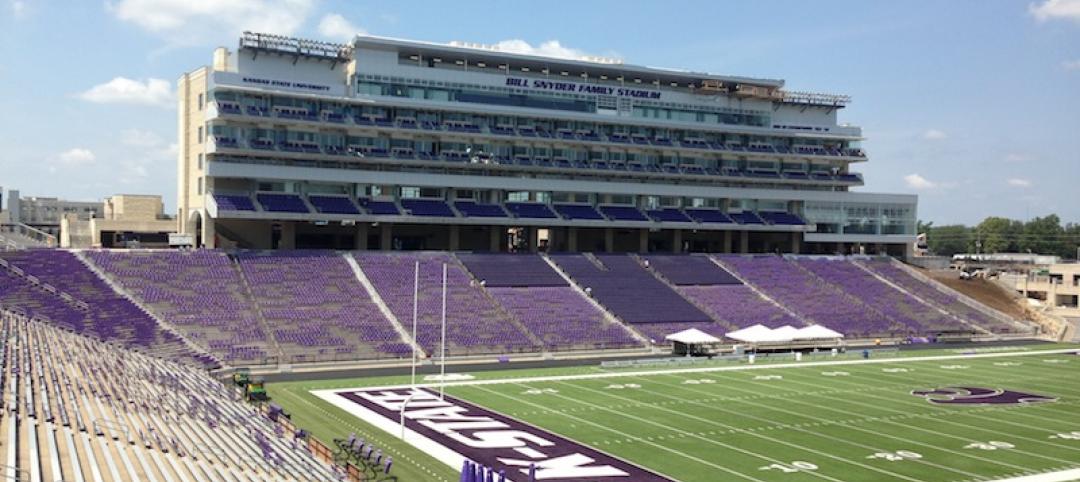
First look: K-State's Bill Snyder Family Stadium expansion
The West Side Stadium Expansion Project at Kansas State's Bill Snyder Family Stadium is the largest project in K-State Athletics history.

| Aug 27, 2013
Industrial Sector Report [2013 Giants 300 Report]
Building Design+Construction's rankings of the nation's largest industrial sector design and construction firms, as reported in the 2013 Giants 300 Report.
| Aug 26, 2013
What you missed last week: Architecture billings up again; record year for hotel renovations; nation's most expensive real estate markets
BD+C's roundup of the top construction market news for the week of August 18 includes the latest architecture billings index from AIA and a BOMA study on the nation's most and least expensive commercial real estate markets.

| Aug 26, 2013
Chicago Bears kick off season at renovated Halas Hall
An upgraded locker room, expanded weight room, and updated dining room with an outdoor patio greeted the Chicago Bears when they arrived at Halas Hall for practice this month. The improvements are part of a major expansion and renovation of the Bears’ headquarters in Lake Forest, Ill., completed by Mortenson Construction in less than seven months.

| Aug 22, 2013
Energy-efficient glazing technology [AIA Course]
This course discuses the latest technological advances in glazing, which make possible ever more efficient enclosures with ever greater glazed area.

| Aug 22, 2013
Warehouse remake: Conversion project turns derelict freight terminal into modern office space [slideshow]
The goal of the Freight development is to attract businesses to an abandoned industrial zone north of downtown Denver.
| Aug 21, 2013
AIA: Architecture billings on the rise in July
The Architecture Billings Index for July was 52.7, up from a mark of 51.6 in June. This score reflects an increase in demand for design services (any score above 50 indicates an increase in billings).

| Aug 20, 2013
40 Under 40 retrospective: ‘U40s’ take on continuing ed, snake’s blood
Every month we’ll be touching base with past 40 Under 40 honorees to see what’s been happening in their professional and personal lives since winning the award. This month: An accomplished author of test-prep books and an architect who headed to China when the American economy turned sour.


