

Grumman|Butkus Associates, a firm of energy efficiency consultants and sustainable design engineers, recently released the results of its 2023 Hospital Energy and Water Benchmarking Survey, focusing on healthcare facilities’ resource usage trends and costs for calendar years 2021 and 2022.
For the first time, the report charts and historical data are available at a dedicated website, including pull-down menus for sorting data by facility characteristics (for instance, hospitals with purchased steam or in-house laundry). These tools will make it easier for users to make comparisons between the survey data and patterns in their own facilities.
Users can also choose some aspects of data presentation (for instance, $/therm vs. $/MMBtu in the fossil fuel energy chart).
Hospital Energy and Water Use Trends
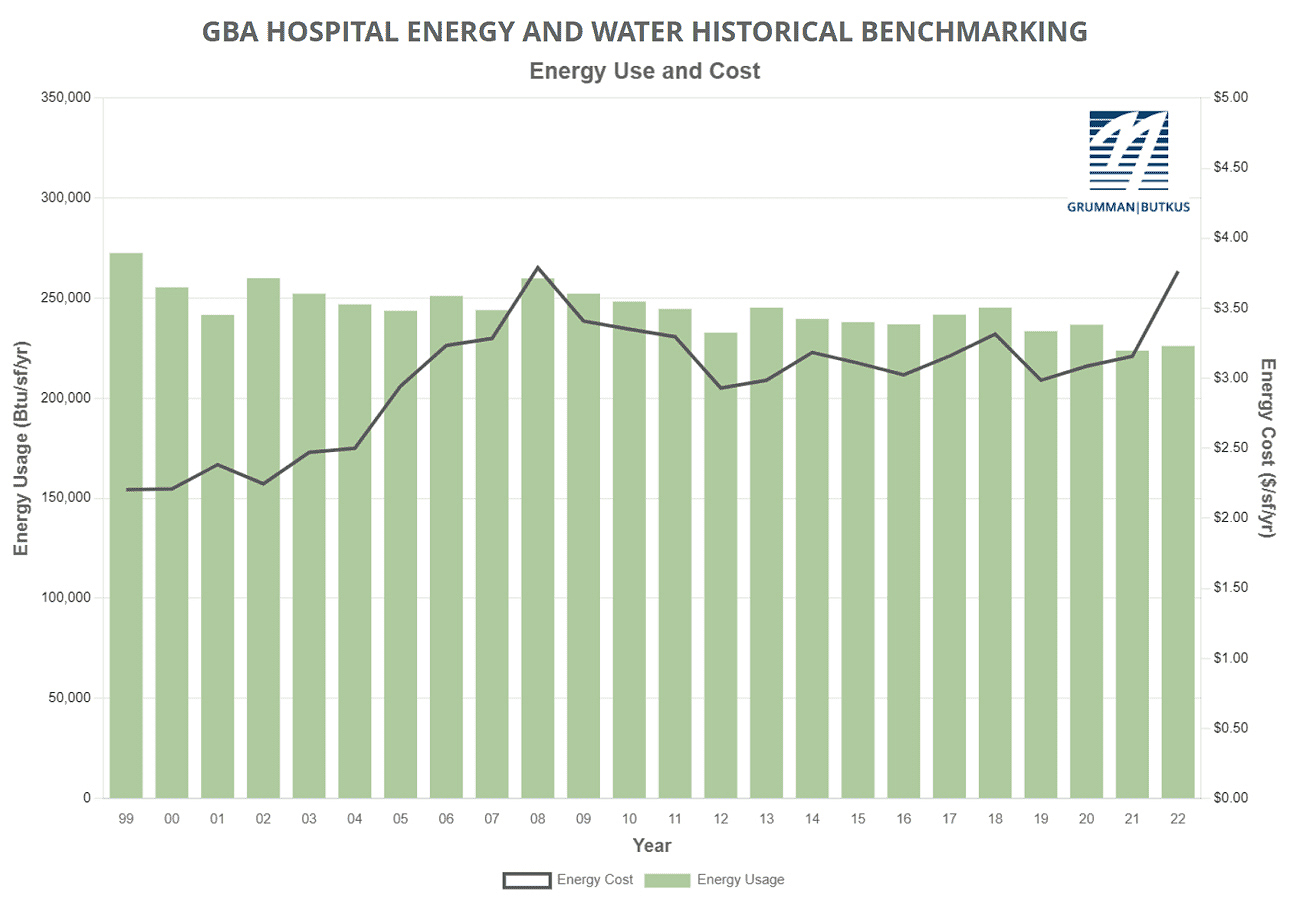
Since GBA initiated the survey nearly 30 years ago, hospitals’ overall fossil fuel use has trended downward, but electricity use isn’t declining as much. The average combined Btu/ft2 (electricity plus gas/steam) for participating facilities was 223,778 in 2021 and 226,081 in 2022, both down from the 236,743 Btu/ft2 reported in CY2020. However, interpretation of year-to-year trends should be tempered by the realization that the respondent pool for 2020-22 would have usage patterns influenced by the COVID-19 pandemic.
Square-foot prices for gas/steam rose ($0.75 in 2021 and $0.98 in 2022, compared with $0.65 in 2020). Square-foot prices for electricity fluctuated ($2.40 in 2021 and $2.78 in 2022, compared with $2.44 in 2020). The overall result is that total reported ft2 costs for energy (gas/steam plus electric) have increased: $3.16 in 2021 and $3.76 in 2022, compared with $3.09 for 2020.
Hospitals’ average carbon footprint has remained fairly steady at 50 to 60 pounds of CO2 equivalent per ft2 per year since GBA began calculating carbon data in 1999. However, Scope 1 and Scope 2 CO2 footprint in 2022 was the lowest it has been since GBA started reporting on carbon emissions (36.96 average CO2 equivalent per ft2 per year). This pattern is likely related to changes in the electric grid, as utilities themselves strive to decarbonize.
Participating facilities displayed a broad range of energy usage patterns. For instance, a few of this year’s survey participants reported fossil fuel consumption of more than 200,000 Btu/sf/year, compared with the general mid-range of facilities (about 130,000 Btu/sf/year) and those that used the least (75,000 Btu/sf/year or less). These variations mean that hospital fossil fuel energy costs may exceed $2.00/sf/year or come in at less than $0.50/sf/year.
Similarly, several hospitals reported consuming more than 40 kWh/sf/year in electrical energy, compared with a mid-range of about 27 kWh/sf/year. A few survey participants squeaked in at less than 20 kWh/sf/year. The wide differences in usage mean that some participants are paying well over $4.00/sf/year for electrical energy, while many are getting by with less than $2.50 and a few with less than $1.75.
“Facilities that have high unit costs for energy should view this as an opportunity,” says GBA-Illinois Chairman Dan Doyle. “For example, a project that would have a five-year payback at an ‘average’ facility may have a payback of just 2.5 or three years at a facility with higher unit costs for energy.”
Hospital water/sewer use has been gradually declining, but was up in both 2021 and 2022, at 42 and 51 gallons per square foot per year, respectively, compared with about 36 gallons per square foot per year in CY2020. The leap between 2021 and 2022 was likely a statistical anomaly caused by different respondent mix between those two years. Costs for water/sewer are undoubtedly rising, however. Respondents reported costs of $0.46/square foot in 2021 and $0.43/square foot in 2022, compared with the $0.27/ft2 that hospitals were spending in 2006, the year GBA began tracking water/sewer use.
“GBA expects the general trend of rising water and sewer costs to continue,” says Doyle. “Price hikes not only reflect increasing costs to extract and treat the water, but also the expense of upgrading or replacing aging infrastructure. In addition, some cash-strapped governmental entities may view water as a revenue sources.”
Since 1995, the GBA survey has provided a free annual benchmarking resource. Hospitals are invited to participate by submitting responses to a short list of questions. Information for this edition was provided by a combined total of 181 hospitals located in Illinois, Wisconsin, New Jersey, Indiana, Michigan, Nevada, and numerous other states coast-to-coast.
Full results and analysis, as well as information about participating in the 2024 survey (2023 data), are available at the firm’s website: grummanbutkus.com/HES.
For additional information, contact Dan Doyle (ddoyle@grummanbutkus.com) or Julie Higginbotham (jhigginbotham@grummanbutkus.com).
Related Stories

Healthcare Facilities | Mar 4, 2021
Behavior mapping: Taking care of the caregivers through technology
Research suggests that the built environment may help reduce burnout.

Healthcare Facilities | Feb 25, 2021
The Weekly show, Feb 25, 2021: When healthcare designers become patients, and machine learning for building design
This week on The Weekly show, BD+C editors speak with AEC industry leaders from BK Facility Consulting, cove.tool, and HMC Architects about what two healthcare designers learned about the shortcomings—and happy surprises—of healthcare facilities in which they found themselves as patients, and how AEC firms can use machine learning to optimize design, cost, and sustainability, and prioritize efficiency protocols.

Market Data | Feb 24, 2021
2021 won’t be a growth year for construction spending, says latest JLL forecast
Predicts second-half improvement toward normalization next year.

Sponsored | Biophilic Design | Feb 19, 2021
Stantec & LIGHTGLASS Simulate Daylight in a Windowless Patient Space

Healthcare Facilities | Feb 18, 2021
The Weekly show, Feb 18, 2021: What patients want from healthcare facilities, and Post-COVID retail trends
This week on The Weekly show, BD+C editors speak with AEC industry leaders from JLL and Landini Associates about what patients want from healthcare facilities, based on JLL's recent survey of 4,015 patients, and making online sales work for a retail sector recovery.

Healthcare Facilities | Feb 5, 2021
Healthcare design in a post-COVID world
COVID-19’s spread exposed cracks in the healthcare sector, but also opportunities in this sector for AEC firms.

Healthcare Facilities | Feb 3, 2021
$545 million patient pavilion at Vassar Brothers Medical Center completes
CallisonRTKL designed the project.
Modular Building | Jan 26, 2021
Offsite manufacturing startup iBUILT positions itself to reduce commercial developers’ risks
iBUILT plans to double its production capacity this year, and usher in more technology and automation to the delivery process.
Healthcare Facilities | Jan 16, 2021
New patient pavilion is Poughkeepsie, N.Y.’s largest construction project to date
The pavilion includes a 66-room Emergency Department.
Healthcare Facilities | Jan 9, 2021
As mental healthcare is destigmatized, demand for treatment centers is rising
NBBJ is among the firms tapping into this trend.


