


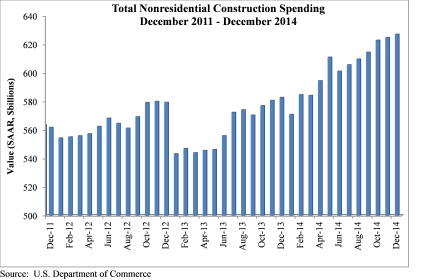
Nonresidential construction spending expanded 0.4% on a monthly basis in December 2014, according to the Feb. 2 release from the U.S. Census Bureau.
Spending for the month totaled $627.1 billion on a seasonally adjusted, annualized basis, 5.9% higher than December 2013. The government also upwardly revised November's spending estimate from $617 billion to $624.8 billion and October's figure from $623 billion to $627.4 billion.
"Despite the slight expansion indicated in today's report, nonresidential construction lost some of its momentum during the final two months of 2014; however, this should represent only a minor dip in the industry's momentum headed into 2015," said Associated Builders and Contractors Chief Economist Anirban Basu. "It is possible that the past two spending reports indicate the U.S. economy is not as robust as many analysts believe but it is important to remember that 2014, as whole, was a solid year of recovery for the industry and total nonresidential construction spending was 6.6 % higher than in 2013.
"While some may surmise that the lack of momentum in nonresidential construction spending is related to the sharp fall in oil prices, this does not appear to be the case," said Basu. "Oil-related construction categories like transportation and manufacturing have retained their momentum while categories such as public safety and education have experienced declines in spending. It is also possible that the decline simply represents noise in the data; after all, October and November's figures have been revised higher while the December estimate remains preliminary."
Seven of 16 nonresidential construction subsectors posted increases in spending in December on a monthly basis:
- Communication construction spending expanded 2.5% for the month, but is down 9.5% for the year.
- Highway and street-related construction spending grew 2.5% in December and is up 10.5% compared to the same time last year.
- Power-related construction spending grew 1% for the month, but is 8.3% lower than the same time one year ago.
- Conservation and development-related construction spending grew 1.7% for the month and is up 24% on a yearly basis.
- Office-related construction spending grew 1.7% in December and is up 17.6% from the same time one year ago.
- Manufacturing-related spending expanded by 2% in December and is up 18.1% for the year.
- Amusement and recreation-related construction spending gained 1.9% on a monthly basis and is up 11.9% from the same time last year.
Spending in nine nonresidential construction subsectors declined in December on a monthly basis:
- Healthcare-related construction spending fell 1% for the month and is down 2.1% for the year.
- Education-related construction spending fell 1.2% for the month, but is up 3.9% on a year-over-year basis.
- Spending in the water supply category fell 0.3% from November but is 10.1% lower than at the same time last year.
- Construction spending in the transportation category fell 0.2% on a monthly basis, but has expanded by 9.5% on an annual basis.
- Public safety-related construction spending fell 4% on a monthly basis and is down 9.5% on a year-over-year basis.
- Commercial construction spending lost 1.7% in December, but is up 10.7% on a year-over-year basis.
- Religious spending fell 4.1% for the month and is down 1.3% from the same time last year.
- Lodging construction spending fell 1.4% on a monthly basis, but is up 18.3% on a year-over-year basis.
- Sewage and waste disposal-related construction spending fell 2% for the month, but has grown 10.5% on a 12-month basis.
To view the previous spending report, click here.
Related Stories

| Jun 18, 2014
Arup uses 3D printing to fabricate one-of-a-kind structural steel components
The firm's research shows that 3D printing has the potential to reduce costs, cut waste, and slash the carbon footprint of the construction sector.

| Jun 18, 2014
Architecture Billings Index shows increase in design activity
The American Institute of Architects reported that the May ABI score was 52.6, up sharply from a mark of 49.6 in April. This score reflects an increase in design activity.

| Jun 17, 2014
Must see: If music were architecture in 27 illustrations
From Miles Davis to Björk to Manu Chao to Bach, Babina visualizes how these sounds will look like if they were visible in the form of architecture.

| Jun 17, 2014
Nation's largest Thai Buddhist temple opens near Boston
The $60 million facility built in honor of King Rama IX of Thailand is the largest Thai Buddhist temple outside of Thailand.

| Jun 17, 2014
U.S. Census report examines why Americans move
According to the U.S. Census Bureau, 35.9 million people moved between 2012 and 2013, meaning that 11.7% of the U.S. population moved in one year. The report seeks to examine why.

| Jun 17, 2014
World's tallest pair of towers to serve as 'environmental catalyst' for China
The Phoenix Towers are expected to reach 1 km, the same height as Adrian Smith and Gordon Gill's Kingdom Tower, but would set a record for multiple towers in one development.
| Jun 16, 2014
6 U.S. cities at the forefront of innovation districts
A new Brookings Institution study records the emergence of “competitive places that are also cool spaces.”

| Jun 13, 2014
Gilbane Building Company names new president and chief operating officer
Gilbane Building company hires new president and COO

| Jun 13, 2014
First look: BIG's spiraling museum for watchmaker Audemars Piguet
The glass-and-steel pavilion's spiral structure acts as a storytelling device for the company's history.

| Jun 13, 2014
Grocery stores, restaurants make neighborhoods most desirable [infographic]
John Burns Real Estate Consulting ranks the top 25 housing amenities by generation, based on feedback from more than 20,000 home shoppers.


