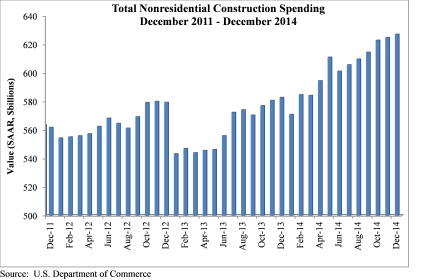
Nonresidential construction spending expanded 0.4% on a monthly basis in December 2014, according to the Feb. 2 release from the U.S. Census Bureau.
Spending for the month totaled $627.1 billion on a seasonally adjusted, annualized basis, 5.9% higher than December 2013. The government also upwardly revised November's spending estimate from $617 billion to $624.8 billion and October's figure from $623 billion to $627.4 billion.
"Despite the slight expansion indicated in today's report, nonresidential construction lost some of its momentum during the final two months of 2014; however, this should represent only a minor dip in the industry's momentum headed into 2015," said Associated Builders and Contractors Chief Economist Anirban Basu. "It is possible that the past two spending reports indicate the U.S. economy is not as robust as many analysts believe but it is important to remember that 2014, as whole, was a solid year of recovery for the industry and total nonresidential construction spending was 6.6 % higher than in 2013.

"While some may surmise that the lack of momentum in nonresidential construction spending is related to the sharp fall in oil prices, this does not appear to be the case," said Basu. "Oil-related construction categories like transportation and manufacturing have retained their momentum while categories such as public safety and education have experienced declines in spending. It is also possible that the decline simply represents noise in the data; after all, October and November's figures have been revised higher while the December estimate remains preliminary."
Seven of 16 nonresidential construction subsectors posted increases in spending in December on a monthly basis:
- Communication construction spending expanded 2.5% for the month, but is down 9.5% for the year.
- Highway and street-related construction spending grew 2.5% in December and is up 10.5% compared to the same time last year.
- Power-related construction spending grew 1% for the month, but is 8.3% lower than the same time one year ago.
- Conservation and development-related construction spending grew 1.7% for the month and is up 24% on a yearly basis.
- Office-related construction spending grew 1.7% in December and is up 17.6% from the same time one year ago.
- Manufacturing-related spending expanded by 2% in December and is up 18.1% for the year.
- Amusement and recreation-related construction spending gained 1.9% on a monthly basis and is up 11.9% from the same time last year.
Spending in nine nonresidential construction subsectors declined in December on a monthly basis:
- Healthcare-related construction spending fell 1% for the month and is down 2.1% for the year.
- Education-related construction spending fell 1.2% for the month, but is up 3.9% on a year-over-year basis.
- Spending in the water supply category fell 0.3% from November but is 10.1% lower than at the same time last year.
- Construction spending in the transportation category fell 0.2% on a monthly basis, but has expanded by 9.5% on an annual basis.
- Public safety-related construction spending fell 4% on a monthly basis and is down 9.5% on a year-over-year basis.
- Commercial construction spending lost 1.7% in December, but is up 10.7% on a year-over-year basis.
- Religious spending fell 4.1% for the month and is down 1.3% from the same time last year.
- Lodging construction spending fell 1.4% on a monthly basis, but is up 18.3% on a year-over-year basis.
- Sewage and waste disposal-related construction spending fell 2% for the month, but has grown 10.5% on a 12-month basis.
To view the previous spending report, click here.
Related Stories
| Aug 11, 2010
2009 Judging Panel
A Matthew H. Johnson, PE Associate Principal Simpson Gumpertz & HegerWaltham, Mass. B K. Nam Shiu, SE, PEVP Walker Restoration Consultants Elgin, Ill. C David P. Callan, PE, CEM, LEED APSVPEnvironmental Systems DesignChicago D Ken Osmun, PA, DBIA, LEED AP Group President, ConstructionWight & Company Darien, Ill.
| Aug 11, 2010
Inspiring Offices: Office Design That Drives Creativity
Office design has always been linked to productivity—how many workers can be reasonably squeezed into a given space—but why isn’t it more frequently linked to creativity? “In general, I don’t think enough people link the design of space to business outcome,” says Janice Linster, partner with the Minneapolis design firm Studio Hive.


