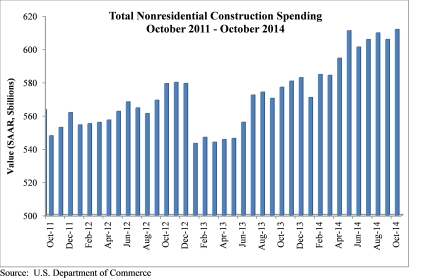
Nonresidential construction spending bounced back in October, expanding 1 percent on a monthly basis and 4.3 percent year over year, according to a Dec. 2 release from the U.S. Census Bureau. Spending for the month totaled $611.8 billion on a seasonally adjusted, annualized basis. Additionally, the government revised the September spending figure up to $605.8 billion from $596.1 billion.
"This month's increase in nonresidential construction spending is far more consistent with the anecdotal information floating around the industry, which generally indicates that firms are becoming busier and that backlog is expanding," said Associated Builders and Contractors (ABC) Chief Economist Anirban Basu. "Although last month's numbers for nonresidential construction spending and employment were disappointing and could have implied the nation's nonresidential construction recovery is stalling, that is not the case.
"The outlook for 2015 remains upbeat," said Basu. "The economy has gained momentum over the past six to seven months and that is consistent with more aggressive construction starts and spending during the year to come. Even as the economy has gained momentum, the Federal Reserve has remained extraordinarily accommodative due in part to benign inflation readings. Low interest rates combined with solid economic momentum likely mean expansion for the nonresidential construction industry during the year ahead."
Eleven of the 16 nonresidential construction subsectors posted monthly increases in spending. Here's a recap:
• Office-related construction spending grew by 2 percent in October and is up 16.3 percent from the same time one year ago.
• Lodging construction spending is up 3.3 percent on a monthly basis and is up 15.9 percent on a year-over-year basis.
• Conservation and development-related construction spending grew 4.6 percent for the month and is up 33.1 percent on a yearly basis.
• Spending in the water supply category expanded 0.9 percent on a monthly basis, but is down 1.8 percent on a year-over-year basis.
• Amusement and recreation-related construction spending expanded 2.2 percent in October and is up 1.4 percent from the same time last year.
• Manufacturing-related spending expanded 3.4 percent on a monthly basis and is up 22.2 percent on an annual basis.
• Healthcare-related construction spending expanded 0.6 percent for the month but is down 8.4 percent from the same time last year.
• Education-related construction spending expanded 1.8 percent for the month and is up 3.6 percent on a year-over-year basis.
• Construction spending in the transportation category expanded 2.7 percent on a monthly basis and has expanded 1.6 percent on an annual basis.
• Highway and street-related construction spending expanded 1.2 percent in October and is up 0.1 percent compared to the same time last year.
• Public safety-related construction spending expanded 11.6 percent on a monthly basis but is down 1.2 percent on a year-over-year basis.
Monthly spending in five nonresidential construction subsectors declined in October. They are:
• Commercial construction spending fell 2.2 percent for the month but has grown 9.1 percent on a year-over-year basis.
• Communication construction spending declined 1.9 percent for the month and is down 9.4 percent for the year.
• Religious construction spending fell 3.7 percent for the month and is down 4.6 percent from the same time last year.
• Sewage and waste disposal-related construction spending declined 0.4 percent for the month and is down 0.2 percent on a 12-month basis.
• Power construction spending fell 1 percent for the month but is 0.7 percent higher than at the same time one year ago.
To view the previous spending report, click here.
Related Stories
| Dec 8, 2011
Keast & Hood Co. part of Statue of Liberty renovation team
Keast & Hood Co., is the structural engineer-of-record for the year-long $27.25 million renovation of the Statue of Liberty.
| Dec 8, 2011
HDR opens office in Shanghai
The office, located in the Chong Hing Finance Center in Shanghai’s busy Huangpu District, will support HDR’s design efforts throughout Asia.
| Dec 8, 2011
HOK elevates the green office standard
Firm achieves LEED Platinum certification in New York office that overlooks Bryant Park.
| Dec 7, 2011
ACE Mentor Program receives Presidential Award for Excellence in Science, Math and Engineering Mentoring
Thornton Tomasetti founding principal Charles H. Thornton responsible for launching ACE.
| Dec 7, 2011
NSF International qualifies first wallcoverings distributor to the New American National Standard for Sustainable Wallcoverings
TRI-KES demonstrates leadership in environmental stewardship as the first distributor to earn qualification.
| Dec 7, 2011
DPR Foundation awards $590,000 to youth organizations
Grants will fund programs for disadvantaged kids across six states.
| Dec 7, 2011
Autodesk agrees to acquire Horizontal Systems
Acquisition extends and accelerates cloud-based BIM solutions for collaboration, data, and lifecycle management.
| Dec 7, 2011
ICS Builders and BKSK Architects complete St. Hilda’s House in Manhattan
The facility's design highlights the inherent link between environmental consciousness and religious reverence.
| Dec 6, 2011
Construction industry leaders gather for forum on diversity
Declared a “groundbreaking” event for the industry, Gilbane’s First Annual National Partners Council Forum addressed diversity and inclusion as well as building partnerships with minority, veteran, and women-owned businesses.


