


Is there life after death? Judging by the commercial office sector, maybe there is. After several years in an advanced stage of morbidity, propped up largely by tenant fitouts and renovations, the office sector may be starting to show signs of life.
The ULI Center for Capital Markets and Real Estate recently stated (based on data from CBRE) that the sector is expected to show “steady and substantial three-year improvements,” with vacancy rates declining from 15.4% this year, to 14.4% in 2013 and 12.3% by year-end 2014.
Rental rates should be up 3.7% in ’13, says the ULI. +
TOP 25 OFFICE SECTOR ARCHITECTURE FIRMS
| Rank | Company | 2011 Office Revenue ($) |
| 1 | Gensler | 432,000,000 |
| 2 | HOK | 144,865,720 |
| 3 | Perkins+Will | 103,737,646 |
| 4 | HDR Architecture | 40,800,000 |
| 5 | Kohn Pedersen Fox Associates | 40,030,000 |
| 6 | Hammel, Green and Abrahamson | 39,600,000 |
| 7 | NBBJ | 38,830,000 |
| 8 | RTKL Associates | 38,055,565 |
| 9 | Nelson | 36,223,716 |
| 10 | SmithGroupJJR | 30,700,000 |
| 11 | Heery International | 29,004,000 |
| 12 | PageSoutherlandPage | 28,130,000 |
| 13 | HLW International | 26,750,000 |
| 14 | HNTB Architecture | 25,231,479 |
| 15 | Cannon Design | 23,000,000 |
| 16 | IBI Group | 22,391,853 |
| 17 | EYP Architecture & Engineering | 20,000,000 |
| 18 | Little | 19,739,500 |
| 19 | LEO A DALY | 16,832,770 |
| 20 | Ware Malcomb | 16,762,000 |
| 21 | DLR Group | 14,000,000 |
| 22 | ZGF Architects | 13,227,504 |
| 23 | RSP Architects | 13,151,000 |
| 24 | HKS | 12,227,874 |
| 25 | Corgan Associates | 12,109,000 |
TOP 25 OFFICE SECTOR ENGINEERING FIRMS
| Rank | Company | 2011 Office Revenue ($) |
| 1 | AECOM Technology Corp. | 1,291,000,000 |
| 2 | Jacobs | 261,100,000 |
| 3 | Parsons Brinckerhoff | 127,900,000 |
| 4 | Science Applications International Corp. | 116,240,000 |
| 5 | URS Corp. | 58,000,000 |
| 6 | Burns & McDonnell | 43,493,660 |
| 7 | Michael Baker Jr., Inc. | 42,890,000 |
| 8 | Stantec | 42,300,000 |
| 9 | Dewberry | 41,215,530 |
| 10 | Thornton Tomasetti | 34,780,000 |
| 11 | WSP USA | 34,500,000 |
| 12 | ESD/Environmental Systems Design | 22,900,000 |
| 13 | Arup | 19,146,849 |
| 14 | Syska Hennessy Group | 18,504,074 |
| 15 | AKF Group | 15,500,000 |
| 16 | Sebesta Blomberg | 14,590,000 |
| 17 | GHT Limited | 13,891,000 |
| 18 | Clark Nexsen | 13,029,482 |
| 19 | Glumac | 11,736,618 |
| 20 | KPFF Consulting Engineers | 10,000,000 |
| 21 | R.G. Vanderweil Engineers | 9,354,500 |
| 22 | Wiss, Janney, Elstner Associates | 8,967,000 |
| 23 | RDK Engineers | 8,835,000 |
| 24 | H&A Architects & Engineers | 7,757,000 |
| 25 | Interface Engineering | 7,290,488 |
TOP 25 OFFICE SECTOR CONSTRUCTION FIRMS
| Rank | Company | 2011 Office Revenue ($) |
| 1 | Turner Corporation, The | 1,489,944,482 |
| 2 | Clark Group | 1,148,992,603 |
| 3 | Structure Tone | 1,004,320,000 |
| 4 | Balfour Beatty US | 825,948,471 |
| 5 | Hensel Phelps Construction | 619,660,000 |
| 6 | Gilbane Building Co. | 617,058,000 |
| 7 | PCL Construction Enterprises | 594,444,509 |
| 8 | BL Harbert International | 589,000,000 |
| 9 | James G. Davis Construction Corp. | 450,000,000 |
| 10 | Clayco | 426,000,000 |
| 11 | Suffolk Construction | 388,644,645 |
| 12 | Whiting-Turner Contracting Co., The | 386,520,693 |
| 13 | Holder Construction | 327,000,000 |
| 14 | Tutor Perini Corp. | 312,940,000 |
| 15 | Weitz Company, The | 302,418,397 |
| 16 | Ryan Companies US | 288,463,756 |
| 17 | DPR Construction | 261,922,722 |
| 18 | Jacobs | 261,100,000 |
| 19 | Webcor Builders | 229,121,806 |
| 20 | Mortenson | 221,980,000 |
| 21 | Walsh Group, The | 211,738,006 |
| 22 | JE Dunn Construction | 203,050,158 |
| 23 | Pepper Construction Group | 197,357,000 |
| 24 | Jones Lang LaSalle | 180,000,000 |
| 25 | Lend Lease | 173,228,092 |
Related Stories

| Nov 27, 2013
Exclusive survey: Revenues increased at nearly half of AEC firms in 2013
Forty-six percent of the respondents to an exclusive BD+C survey of AEC professionals reported that revenues had increased this year compared to 2012, with another 24.2% saying cash flow had stayed the same.

| Nov 27, 2013
Wonder walls: 13 choices for the building envelope
BD+C editors present a roundup of the latest technologies and applications in exterior wall systems, from a tapered metal wall installation in Oklahoma to a textured precast concrete solution in North Carolina.

| Nov 27, 2013
University reconstruction projects: The 5 keys to success
This AIA CES Discovery course discusses the environmental, economic, and market pressures affecting facility planning for universities and colleges, and outlines current approaches to renovations for critical academic spaces.

| Nov 26, 2013
7 ways to make your firm more successful
Like all professional services businesses, AEC firms are challenged to effectively manage people. And even though people can be rather unpredictable, a firm’s success doesn’t have to be. Here are seven ways to make your firm more successful in the face of market variability and uncertainty.

| Nov 26, 2013
Design-build downsized: Applying the design-build method in an era of smaller projects
Any project can benefit from the collaborative spirit and cooperative relationships embodied by design-build. But is there a point of diminishing return where the design-build project delivery model just doesn't make sense for small projects? Design-build expert Lisa Cooley debates the issue.

| Nov 25, 2013
Electronic plan review: Coming soon to a city near you?
With all the effort AEC professionals put into leveraging technology to communicate digitally on projects, it is a shame that there is often one major road block that becomes the paper in their otherwise “paperless” project: the local city planning and permitting department.
| Nov 22, 2013
Kieran Timberlake, PE International develop BIM tool for green building life cycle assessment
Kieran Timberlake and PE International have developed Tally, an analysis tool to help BIM users keep better score of their projects’ complete environmental footprints.

| Nov 20, 2013
Architecture Billings Index slows in October; project inquiries stay strong
Following three months of accelerating demand for design services, the Architecture Billings Index reflected a somewhat slower pace of growth in October. The October ABI score was 51.6, down from a mark of 54.3 in September.
| Nov 19, 2013
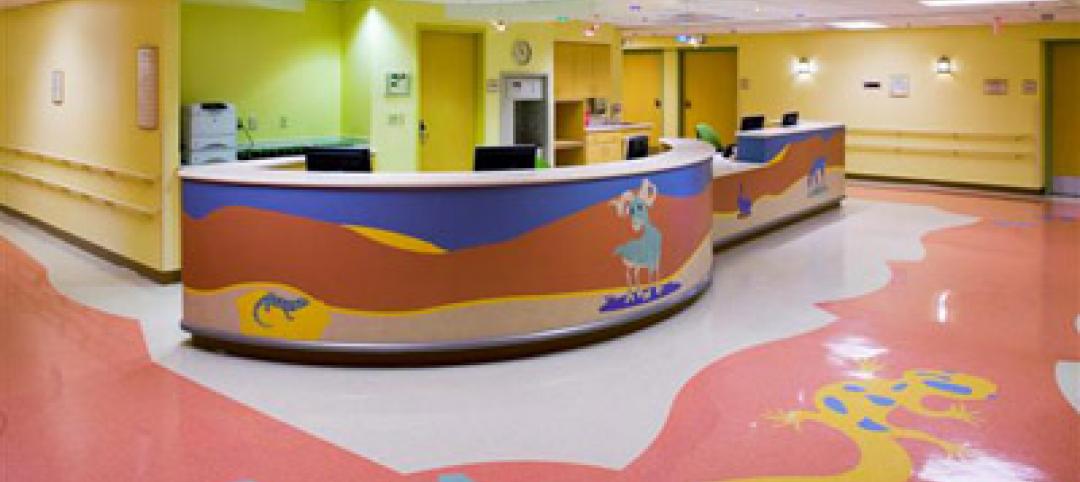
Pediatric design in an adult hospital setting
Freestanding pediatric facilities have operational and physical characteristics that differ from those of adult facilities.

| Nov 18, 2013
6 checkpoints when designing a pediatric healthcare unit
As more time and money is devoted to neonatal and pediatric research, evidence-based design is playing an increasingly crucial role in the development of healthcare facilities for children. Here are six important factors AEC firms should consider when designing pediatric healthcare facilities.


