Is there life after death? Judging by the commercial office sector, maybe there is. After several years in an advanced stage of morbidity, propped up largely by tenant fitouts and renovations, the office sector may be starting to show signs of life.
The ULI Center for Capital Markets and Real Estate recently stated (based on data from CBRE) that the sector is expected to show “steady and substantial three-year improvements,” with vacancy rates declining from 15.4% this year, to 14.4% in 2013 and 12.3% by year-end 2014.
Rental rates should be up 3.7% in ’13, says the ULI. +
TOP 25 OFFICE SECTOR ARCHITECTURE FIRMS
| Rank | Company | 2011 Office Revenue ($) |
| 1 | Gensler | 432,000,000 |
| 2 | HOK | 144,865,720 |
| 3 | Perkins+Will | 103,737,646 |
| 4 | HDR Architecture | 40,800,000 |
| 5 | Kohn Pedersen Fox Associates | 40,030,000 |
| 6 | Hammel, Green and Abrahamson | 39,600,000 |
| 7 | NBBJ | 38,830,000 |
| 8 | RTKL Associates | 38,055,565 |
| 9 | Nelson | 36,223,716 |
| 10 | SmithGroupJJR | 30,700,000 |
| 11 | Heery International | 29,004,000 |
| 12 | PageSoutherlandPage | 28,130,000 |
| 13 | HLW International | 26,750,000 |
| 14 | HNTB Architecture | 25,231,479 |
| 15 | Cannon Design | 23,000,000 |
| 16 | IBI Group | 22,391,853 |
| 17 | EYP Architecture & Engineering | 20,000,000 |
| 18 | Little | 19,739,500 |
| 19 | LEO A DALY | 16,832,770 |
| 20 | Ware Malcomb | 16,762,000 |
| 21 | DLR Group | 14,000,000 |
| 22 | ZGF Architects | 13,227,504 |
| 23 | RSP Architects | 13,151,000 |
| 24 | HKS | 12,227,874 |
| 25 | Corgan Associates | 12,109,000 |
TOP 25 OFFICE SECTOR ENGINEERING FIRMS
| Rank | Company | 2011 Office Revenue ($) |
| 1 | AECOM Technology Corp. | 1,291,000,000 |
| 2 | Jacobs | 261,100,000 |
| 3 | Parsons Brinckerhoff | 127,900,000 |
| 4 | Science Applications International Corp. | 116,240,000 |
| 5 | URS Corp. | 58,000,000 |
| 6 | Burns & McDonnell | 43,493,660 |
| 7 | Michael Baker Jr., Inc. | 42,890,000 |
| 8 | Stantec | 42,300,000 |
| 9 | Dewberry | 41,215,530 |
| 10 | Thornton Tomasetti | 34,780,000 |
| 11 | WSP USA | 34,500,000 |
| 12 | ESD/Environmental Systems Design | 22,900,000 |
| 13 | Arup | 19,146,849 |
| 14 | Syska Hennessy Group | 18,504,074 |
| 15 | AKF Group | 15,500,000 |
| 16 | Sebesta Blomberg | 14,590,000 |
| 17 | GHT Limited | 13,891,000 |
| 18 | Clark Nexsen | 13,029,482 |
| 19 | Glumac | 11,736,618 |
| 20 | KPFF Consulting Engineers | 10,000,000 |
| 21 | R.G. Vanderweil Engineers | 9,354,500 |
| 22 | Wiss, Janney, Elstner Associates | 8,967,000 |
| 23 | RDK Engineers | 8,835,000 |
| 24 | H&A Architects & Engineers | 7,757,000 |
| 25 | Interface Engineering | 7,290,488 |
TOP 25 OFFICE SECTOR CONSTRUCTION FIRMS
| Rank | Company | 2011 Office Revenue ($) |
| 1 | Turner Corporation, The | 1,489,944,482 |
| 2 | Clark Group | 1,148,992,603 |
| 3 | Structure Tone | 1,004,320,000 |
| 4 | Balfour Beatty US | 825,948,471 |
| 5 | Hensel Phelps Construction | 619,660,000 |
| 6 | Gilbane Building Co. | 617,058,000 |
| 7 | PCL Construction Enterprises | 594,444,509 |
| 8 | BL Harbert International | 589,000,000 |
| 9 | James G. Davis Construction Corp. | 450,000,000 |
| 10 | Clayco | 426,000,000 |
| 11 | Suffolk Construction | 388,644,645 |
| 12 | Whiting-Turner Contracting Co., The | 386,520,693 |
| 13 | Holder Construction | 327,000,000 |
| 14 | Tutor Perini Corp. | 312,940,000 |
| 15 | Weitz Company, The | 302,418,397 |
| 16 | Ryan Companies US | 288,463,756 |
| 17 | DPR Construction | 261,922,722 |
| 18 | Jacobs | 261,100,000 |
| 19 | Webcor Builders | 229,121,806 |
| 20 | Mortenson | 221,980,000 |
| 21 | Walsh Group, The | 211,738,006 |
| 22 | JE Dunn Construction | 203,050,158 |
| 23 | Pepper Construction Group | 197,357,000 |
| 24 | Jones Lang LaSalle | 180,000,000 |
| 25 | Lend Lease | 173,228,092 |
Related Stories
| May 10, 2012
Chapter 6 Energy Codes + Reconstructed Buildings: 2012 and Beyond
Our experts analyze the next generation of energy and green building codes and how they impact reconstruction.
| May 10, 2012
Chapter 5 LEED-EB and Green Globes CIEB: Rating Sustainable Reconstruction
Certification for existing buildings under these two rating programs has overtaken that for new construction.
| May 10, 2012
Chapter 4 Business Case for High-Performance Reconstructed Buildings
Five reconstruction projects in one city make a bottom-line case for reconstruction across the country.
| May 10, 2012
Chapter 3 How Building Technologies Contribute to Reconstruction Advances
Building Teams are employing a wide variety of components and systems in their reconstruction projects.
| May 10, 2012
Chapter 2 Exemplary High-Performance Reconstruction Projects
Several case studies show how to successfully renovate existing structures into high-performance buildings.
| May 9, 2012
Chapter 1 Reconstruction: ‘The 99% Solution’ for Energy Savings in Buildings
As a share of total construction activity reconstruction has been on the rise in the U.S. and Canada in the last few years, which creates a golden opportunity for extensive energy savings.
| May 9, 2012
International green building speaker to keynote Australia’s largest building systems trade show
Green building, sustainability consultant, green building book author Jerry Yudelson will be the keynote speaker at the Air-Conditioning, Refrigeration and Building Systems (ARBS) conference in Melbourne, Australia.
| May 9, 2012
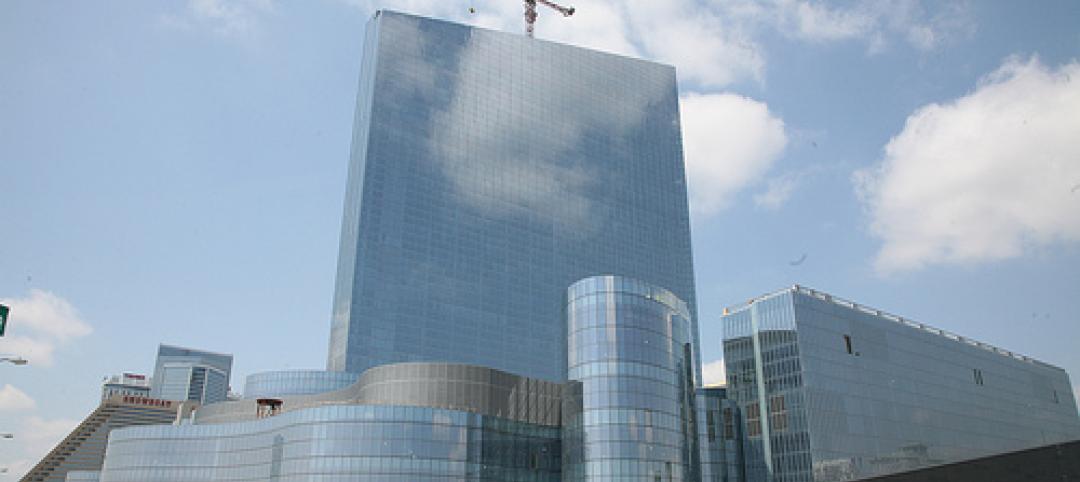
Tishman delivers Revel six weeks early
Revel stands more than 730 feet tall, consists of over 6.3 milliont--sf of space, and is enclosed by 836,762-sf of glass.
| May 9, 2012
Stoddert Elementary School in DC wins first US DOE Green Ribbon School Award
Sustainable materials, operational efficiency, and student engagement create high-performance, healthy environment for life-long learning.
| May 9, 2012
Shepley Bulfinch given IIDA Design award for Woodruff Library?
The design challenges included creating an entry sequence to orient patrons and highlight services; establishing a sense of identity visible from the exterior; and providing a flexible extended-hours access for part of the learning commons.


