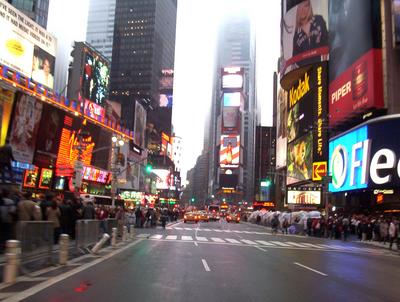
The Building Owners and Managers Association (BOMA) International has identified the most expensive commercial real estate markets in the U.S. The data is drawn from the 2011 Experience Exchange Report (EER), which provides an annual analysis of the office building operating income and expense data compiled across approximately 940 million square feet of commercial office space in more than 6,500 buildings in 278 different markets. The 2011 report is based on operating income and expenses from 2010.
The most expensive U.S. cities, based on total rental income, include:
- New York, N.Y., $48.27 per square foot (psf)
- Washington, D.C., $42.63 psf
- San Mateo, Calif., $41.61 psf
- Santa Monica, Calif., $36.67 psf
- San Francisco, Calif., $34.86 psf
- Boston, Mass., $31.15 psf
- San Jose, Calif., $30.35 psf
- Los Angeles, Calif., $27.97 psf
- West Palm Beach, Fla., $27.71 psf
- Chicago, Ill., $25.20 psf
Total rental income includes rental income from office, retail, and other space, which includes storage areas. Amid the economic downturn in real estate markets, few markets demonstrated significant increases in rental income, suggesting that rental rates remain relatively stable and favorable for tenants seeking to pursue new leases or renegotiate existing ones. Among the most expensive cities, only New York and San Francisco showed increases in rental income.
Gauging most expensive cities on the basis of total operating and fixed expenses produces a slightly different list:
- New York, N.Y., $21.44 psf
- Washington, D.C., $16.86 psf
- Boston, Mass., $15.16 psf
- Morristown, N.J., $14.67 psf
- San Francisco, Calif., $14.43 psf
- Miami, Fla., $12.87 psf
- Santa Monica, Calif., $12.84 psf
- Plainfield, N.J., $12.83 psf
- Chicago, Ill. and Los Angeles, Calif., 12.49 psf
- Newark, N.J., $12.46 psf
Total operating expenses includes all expenses incurred to operate office buildings, including utilities, repairs/maintenance, cleaning, administrative, security and roads and grounds. Fixed expenses include real estate taxes, property taxes and insurance. In New York, average total operating plus fixed expenses were $21.44 per square foot (psf), while in Los Angeles, they averaged $12.96 psf. Operating expenses increased in most markets in the last year. Fixed expenses were volatile, which could be attributed in part to rising utility costs as well as rising real estate taxes. While many cash-constrained cities and municipalities are looking to real estate for tax revenue, many property owners are contesting tax assessments because asset values have decreased due to the economic downturn. BD+C
Related Stories
Lighting | Mar 4, 2024
Illuminating your path to energy efficiency
Design Collaborative's Kelsey Rowe, PE, CLD, shares some tools, resources, and next steps to guide you through the process of lighting design.
MFPRO+ News | Mar 1, 2024
Housing affordability, speed of construction are top of mind for multifamily architecture and construction firms
The 2023 Multifamily Giants get creative to solve the affordability crisis, while helping their developer clients build faster and more economically.
Multifamily Housing | Feb 29, 2024
Manny Gonzalez, FAIA, inducted into Best in American Living Awards Hall of Fame
Manny Gonzalez, FAIA, has been inducted into the BALA Hall of Fame.
K-12 Schools | Feb 29, 2024
Average age of U.S. school buildings is just under 50 years
The average age of a main instructional school building in the United States is 49 years, according to a survey by the National Center for Education Statistics (NCES). About 38% of schools were built before 1970. Roughly half of the schools surveyed have undergone a major building renovation or addition.
MFPRO+ Research | Feb 28, 2024
New download: BD+C's 2023 Multifamily Amenities report
New research from Building Design+Construction and Multifamily Pro+ highlights the 127 top amenities that developers, property owners, architects, contractors, and builders are providing in today’s apartment, condominium, student housing, and senior living communities.
AEC Tech | Feb 28, 2024
How to harness LIDAR and BIM technology for precise building data, equipment needs
By following the Scan to Point Cloud + Point Cloud to BIM process, organizations can leverage the power of LIDAR and BIM technology at the same time. This optimizes the documentation of existing building conditions, functions, and equipment needs as a current condition and as a starting point for future physical plant expansion projects.
Data Centers | Feb 28, 2024
What’s next for data center design in 2024
Nuclear power, direct-to-chip liquid cooling, and data centers as learning destinations are among the emerging design trends in the data center sector, according to Scott Hays, Sector Leader, Sustainable Design, with HED.
Windows and Doors | Feb 28, 2024
DOE launches $2 million prize to advance cost-effective, energy-efficient commercial windows
The U.S. Department of Energy launched the American-Made Building Envelope Innovation Prize—Secondary Glazing Systems. The program will offer up to $2 million to encourage production of high-performance, cost-effective commercial windows.
AEC Innovators | Feb 28, 2024
How Suffolk Construction identifies ConTech and PropTech startups for investment, adoption
Contractor giant Suffolk Construction has invested in 27 ConTech and PropTech companies since 2019 through its Suffolk Technologies venture capital firm. Parker Mundt, Suffolk Technologies’ Vice President–Platforms, recently spoke with Building Design+Construction about his company’s investment strategy.
Performing Arts Centers | Feb 27, 2024
Frank Gehry-designed expansion of the Colburn School performing arts center set to break ground
In April, the Colburn School, an institute for music and dance education and performance, will break ground on a 100,000-sf expansion designed by architect Frank Gehry. Located in downtown Los Angeles, the performing arts center will join the neighboring Walt Disney Concert Hall and The Grand by Gehry, forming the largest concentration of Gehry-designed buildings in the world.


