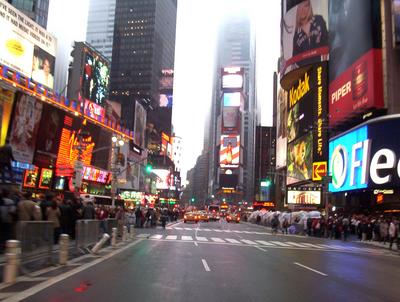
The Building Owners and Managers Association (BOMA) International has identified the most expensive commercial real estate markets in the U.S. The data is drawn from the 2011 Experience Exchange Report (EER), which provides an annual analysis of the office building operating income and expense data compiled across approximately 940 million square feet of commercial office space in more than 6,500 buildings in 278 different markets. The 2011 report is based on operating income and expenses from 2010.
The most expensive U.S. cities, based on total rental income, include:
- New York, N.Y., $48.27 per square foot (psf)
- Washington, D.C., $42.63 psf
- San Mateo, Calif., $41.61 psf
- Santa Monica, Calif., $36.67 psf
- San Francisco, Calif., $34.86 psf
- Boston, Mass., $31.15 psf
- San Jose, Calif., $30.35 psf
- Los Angeles, Calif., $27.97 psf
- West Palm Beach, Fla., $27.71 psf
- Chicago, Ill., $25.20 psf
Total rental income includes rental income from office, retail, and other space, which includes storage areas. Amid the economic downturn in real estate markets, few markets demonstrated significant increases in rental income, suggesting that rental rates remain relatively stable and favorable for tenants seeking to pursue new leases or renegotiate existing ones. Among the most expensive cities, only New York and San Francisco showed increases in rental income.
Gauging most expensive cities on the basis of total operating and fixed expenses produces a slightly different list:
- New York, N.Y., $21.44 psf
- Washington, D.C., $16.86 psf
- Boston, Mass., $15.16 psf
- Morristown, N.J., $14.67 psf
- San Francisco, Calif., $14.43 psf
- Miami, Fla., $12.87 psf
- Santa Monica, Calif., $12.84 psf
- Plainfield, N.J., $12.83 psf
- Chicago, Ill. and Los Angeles, Calif., 12.49 psf
- Newark, N.J., $12.46 psf
Total operating expenses includes all expenses incurred to operate office buildings, including utilities, repairs/maintenance, cleaning, administrative, security and roads and grounds. Fixed expenses include real estate taxes, property taxes and insurance. In New York, average total operating plus fixed expenses were $21.44 per square foot (psf), while in Los Angeles, they averaged $12.96 psf. Operating expenses increased in most markets in the last year. Fixed expenses were volatile, which could be attributed in part to rising utility costs as well as rising real estate taxes. While many cash-constrained cities and municipalities are looking to real estate for tax revenue, many property owners are contesting tax assessments because asset values have decreased due to the economic downturn. BD+C
Related Stories
Office Buildings | Feb 9, 2023
Post-Covid Manhattan office market rebound gaining momentum
Office workers in Manhattan continue to return to their workplaces in sufficient numbers for many of their employers to maintain or expand their footprint in the city, according to a survey of more than 140 major Manhattan office employers conducted in January by The Partnership for New York City.
Giants 400 | Feb 9, 2023
New Giants 400 download: Get the complete at-a-glance 2022 Giants 400 rankings in Excel
See how your architecture, engineering, or construction firm stacks up against the nation's AEC Giants. For more than 45 years, the editors of Building Design+Construction have surveyed the largest AEC firms in the U.S./Canada to create the annual Giants 400 report. This year, a record 519 firms participated in the Giants 400 report. The final report includes 137 rankings across 25 building sectors and specialty categories.
University Buildings | Feb 8, 2023
STEM-focused Kettering University opens Stantec-designed Learning Commons
In Flint, Mich., Kettering University opened its new $63 million Learning Commons, designed by Stantec. The new facility will support collaboration, ideation, and digital technology for the STEM-focused higher learning institution.
Sustainability | Feb 8, 2023
A wind energy system—without the blades—can be placed on commercial building rooftops
Aeromine Technologies’ bladeless system captures and amplifies a building’s airflow like airfoils on a race car.
Codes and Standards | Feb 8, 2023
GSA releases draft of federal low embodied carbon material standards
The General Services Administration recently released a document that outlines standards for low embodied carbon materials and products to be used on federal construction projects.
University Buildings | Feb 7, 2023
Kansas City University's Center for Medical Education Innovation can adapt to changes in medical curriculum
The Center for Medical Education Innovation (CMEI) at Kansas City University was designed to adapt to changes in medical curriculum and pedagogy. The project program supported the mission of training leaders in osteopathic medicine with a state-of-the-art facility that leverages active-learning and simulation-based training.
Multifamily Housing | Feb 7, 2023
Multifamily housing rents flat in January, developers remain optimistic
Multifamily rents were flat in January 2023 as a strong jobs report indicated that fears of a significant economic recession may be overblown. U.S. asking rents averaged $1,701, unchanged from the prior month, according to the latest Yardi Matrix National Multifamily Report.
Giants 400 | Feb 6, 2023
2022 Reconstruction Sector Giants: Top architecture, engineering, and construction firms in the U.S. building reconstruction and renovation sector
Gensler, Stantec, IPS, Alfa Tech, STO Building Group, and Turner Construction top BD+C's rankings of the nation's largest reconstruction sector architecture, engineering, and construction firms, as reported in the 2022 Giants 400 Report.
Giants 400 | Feb 6, 2023
2022 Transit Facility Giants: Top architecture, engineering, and construction firms in the U.S. transit facility sector
Walsh Group, Skanska USA, HDR, Perkins and Will, and AECOM top BD+C's rankings of the nation's largest transit facility sector architecture, engineering, and construction firms, as reported in the 2022 Giants 400 Report.
Giants 400 | Feb 6, 2023
2022 Telecommunications Facility Sector Giants: Top architecture, engineering, and construction firms in the U.S. telecommunications facility sector
AECOM, Alfa Tech, Kraus-Anderson, and Stantec head BD+C's rankings of the nation's largest telecommunications facility sector architecture, engineering, and construction firms, as reported in the 2022 Giants 400 Report.


