


Pop quiz time: Of the total retail sales in 2013, what percentage came from online shopping?
Twenty-five percent? Nope, lower. Twenty percent? Not even close. Ten percent? Getting warmer.
Would you believe that, even with the e-commerce sector’s torrid pace of growth during the past decade, online sales represented just 6% of all retail business last year?
The gloom-and-doom scenario for bricks-and-mortar retail that is portrayed in the media is grossly overstated. It makes for good headlines, but it’s not based in fact, according to Jones Lang LaSalle’s latest retail sector outlook.
“Remember catalogs? Flipping through the pages, dialing up a call center, and placing an order? Web sales are really just replacing that,” said Kris Cooper, Managing Director, JLL Capital Markets. “People still need to see and touch things. The instant gratification of an in-store purchase can’t be discounted. Retailers who want to thrive will need to incorporate it all—hands-on goods, e-commerce, and mobile commerce.”
Giants 300 coverage of Retail brought to you by: C.R. Laurence www.crlaurence.com.
That’s not to say the retail sector doesn’t have its issues. There has been a spate of big-name store closings recently—including Coldwater Creek, Office Depot, and Radio Shack—and retailers continue to struggle to adjust to the structural changes occurring in their industry.
But, all in all, the U.S. retail sector is faring quite well, according to JLL, continuing its solid recovery and exhibiting tightening market conditions. The real estate group expects asking rents nationally to rise 2.7% this year, following 1.1% growth in 2013, and vacancy rates to drop more than 6% for the second straight year.
Net absorption was up a whopping 42% in 2013, to 83.2 million sf. With increased demand for retail space, landlords are starting to exert some power in tenant selection and lease terms, according to JLL.
Here are some highlights from the firm’s Spring 2014 Cross Sector Outlook (http://tinyurl.com/JLLCrossSectorOutlook):
• Power centers are experiencing the tightest overall market conditions, with a total vacancy rate of just 5.1%.
• Investment dollars are flowing into high-quality, grocery-anchored centers and trophy malls. “Demand for those asset types is incredible right now—if only we could convince all the owners to bring those to market,” said Margaret Caldwell, Managing Director, JLL Capital Markets.
• Construction growth will remain marginal during the next 12 months. New construction is focused primarily on single-tenant big-box and discount/wholesale space. Of the multi-tenant projects under construction, the majority are in urban cores and peripheral outlet centers.
• As the market continues to recover, the retail construction sector will eventually see an uptick in construction where tenants demand new space because supply is so constrained, where rents are high enough to justify construction, and where there are few barriers to new development, such as Orlando, Fla.
• Retail property transactions were strong in 2013. Sales of significant retail properties totaled more than $60.8 billion in 2013, up 8% from the previous year. Sales of strip centers and single-tenant properties fared even better, rising 26% year over year.
• There are strong opportunities for development in Sunbelt markets with higher-than-average population growth rates, including Charlotte, N.C., Orlando, and Raleigh, N.C.
SIGNS OF LIFE FOR SHOPPING CENTERS
For the first time since 2007, shopping center development in the U.S. increased year over year, according to Cushman & Wakefield’s new Global Shopping Center Development Report (http://tinyurl.com/CWreport). Nearly 400 shopping centers totaling more than 12.2 million sm of gross leasable area (GLA) were completed in 2013, an increase of 12.7% compared to the previous year.
In fact, the U.S. has accounted for roughly 18% of all new shopping center space delivered worldwide since 2008, according to the report. And there’s no slowdown in sight.
During the next three years, an additional 758 centers containing approximately 11.2 million sm of new GLA will be added to the U.S. inventory, two-thirds of which is expected to be completed in 2014 alone. Developments in California, Florida, and Texas will make up about a third of all new shopping center construction during this period, according to Cushman & Wakefield.
While the large malls get all the headlines—like the long-delayed, 274,000-sm American Dream Meadowlands development in East Rutherford, N.J., and the 149,000-sm Shops at Summerlin (Nev.) Centre—the vast majority of new construction projects are small shopping centers, between 5,000 sm and 20,000 sm, with the average project at 17,700 sm.
Top Retail Architecture Firms
| Rank | Company | 2013 Retail Revenue |
| 1 | Callison | $109,251,013 |
| 2 | Gensler | 105,979,349 |
| 3 | RTKL Associates | 66,018,000 |
| 4 | MulvannyG2 Architecture | 60,000,000 |
| 5 | Stantec | 57,434,454 |
| 6 | WD Partners | 44,000,000 |
| 7 | RSP Architects | 36,346,000 |
| 8 | Little | 27,786,704 |
| 9 | MBH Architects | 25,106,000 |
| 10 | FRCH Design Worldwide | 24,600,000 |
| 11 | P+R Architects | 19,191,791 |
| 12 | Architects Orange | 14,036,393 |
| 13 | CTA Architects Engineers | 14,020,991 |
| 14 | DLR Group | 13,900,000 |
| 15 | NORR | 12,997,934 |
| 16 | CASCO Diversified Corp. | 12,500,000 |
| 17 | Bergmann Associates | 12,416,000 |
| 18 | Nadel | 9,000,000 |
| 19 | Perkins Eastman | 7,750,000 |
| 20 | Ware Malcomb | 7,600,000 |
| 21 | HOK | 7,345,023 |
| 22 | Good Fulton & Farrell | 7,324,000 |
| 23 | LawKingdon Architecture | 7,250,000 |
| 24 | Cooper Carry | 4,000,988 |
| 25 | API | 3,800,000 |
| 26 | Massa Montalto Architects | 3,482,000 |
| 27 | Beyer Blinder Belle | 3,205,403 |
| 28 | RS&H | 2,450,000 |
| 29 | Smallwood, Reynolds, Stewart, Stewart & Associates | 2,391,617 |
| 30 | Vocon | 2,366,525 |
| 31 | Gresham, Smith and Partners | 2,299,000 |
| 32 | Cuningham Group Architecture | 2,166,411 |
| 33 | ai Design Group | 2,093,530 |
| 34 | Solomon Cordwell Buenz | 1,700,000 |
| 35 | LPA | 1,637,397 |
| 36 | BLTa | 1,302,000 |
| 37 | NBBJ | 1,285,000 |
| 38 | Kohn Pedersen Fox Associates | 1,280,000 |
| 39 | TK Architects | 1,155,876 |
| 40 | LS3P | 1,061,129 |
| 41 | Ratio Architects | 990,326 |
| 42 | Eppstein Uhen Architects | 954,480 |
| 43 | RDH Interests | 922,242 |
| 44 | Carrier Johnson + Culture | 702,235 |
| 45 | Environetics | 625,747 |
| 46 | Colkitt & Company | 600,000 |
| 47 | GBBN Architects | 558,000 |
| 48 | Harvard Jolly Architecture | 533,943 |
| 49 | VOA Associates | 521,057 |
| 50 | JRS Architect | 490,000 |
| 51 | WATG | Wimberly Interiors | 472,000 |
| 52 | SchenkelShultz Architecture | 453,000 |
| 53 | Nelson | 393,822 |
| 54 | Goodwyn Mills & Cawood | 378,423 |
| 55 | Wight & Company | 371,000 |
| 56 | Moody Nolan | 361,308 |
| 57 | PGAL | 350,300 |
| 58 | Parkhill, Smith & Cooper | 336,000 |
| 59 | Montroy Andersen DeMarco | 310,000 |
| 60 | Becker Morgan Group | 287,996 |
| 61 | PHX Architecture | 280,000 |
| 62 | Morris Architects | 260,000 |
| 63 | BRPH | 225,000 |
| 64 | Mithun | 210,000 |
| 65 | FitzGerald Associates Architects | 151,500 |
| 66 | Clark Nexsen | 143,328 |
| 67 | Commonwealth Architects | 141,268 |
| 68 | Baskervill | 115,284 |
| 69 | Skidmore, Owings & Merrill | 108,913 |
| 70 | Adache Group Architects | 100,000 |
| 71 | Corgan | 74,847 |
| 72 | Hnedak Bobo Group | 72,000 |
| 73 | Hoefer Wysocki Architecture | 70,000 |
| 74 | Niles Bolton Associates | 65,728 |
| 75 | ATA Beilharz Architects | 60,180 |
| 76 | Hensley Lamkin Rachel | 50,000 |
| 77 | KZF Design | 47,356 |
| 78 | Heery International | 45,840 |
| 79 | TEG Architects | 12,163 |
Top Retail Engineering Firms
| Rank | Company | 2013 Retail Revenue |
| 1 | Jacobs | $182,720,000 |
| 2 | AECOM Technology Corp. | 105,890,000 |
| 3 | Henderson Engineers | 43,369,857 |
| 4 | URS Corp. | 36,003,188 |
| 5 | Wiss, Janney, Elstner Associates | 19,090,000 |
| 6 | Parsons Brinckerhoff | 16,431,889 |
| 7 | Dewberry | 9,513,612 |
| 8 | Thornton Tomasetti | 8,339,454 |
| 9 | Wallace Engineering | 7,667,000 |
| 10 | KLH Engineers | 6,506,748 |
| 11 | Shive-Hattery | 6,232,480 |
| 12 | Arup | 5,674,014 |
| 13 | Dunham Associates | 5,500,000 |
| 14 | Highland Associates | 4,600,000 |
| 15 | Magnusson Klemencic Associates | 4,133,492 |
| 16 | Coffman Engineers | 3,992,285 |
| 17 | Hixson Architecture, Engineering, Interiors | 3,100,000 |
| 18 | Davis, Bowen & Friedel | 2,748,648 |
| 19 | Leidos | 2,520,000 |
| 20 | WSP Group | 2,270,000 |
| 21 | Fishbeck, Thompson, Carr & Huber | 2,200,000 |
| 22 | AKF Group | 2,140,000 |
| 23 | French & Parrello Associates | 1,985,000 |
| 24 | KJWW Engineering Consultants | 1,686,418 |
| 25 | RDK Engineers | 1,670,000 |
| 26 | Martin/Martin | 1,614,144 |
| 27 | Interface Engineering | 1,573,325 |
| 28 | Simpson Gumpertz & Heger | 1,570,000 |
| 29 | Aon Fire Protection Engineering Corp. | 1,500,000 |
| 30 | CTLGroup | 1,450,000 |
| 31 | SSOE Group | 1,423,552 |
| 32 | Graef | 1,189,813 |
| 33 | Bala Consulting Engineers | 1,051,000 |
| 34 | M-E Engineers | 1,000,000 |
| 35 | Heapy Engineering | 969,445 |
| 36 | Wick Fisher White | 893,105 |
| 37 | OLA Consulting Engineers | 888,800 |
| 38 | Walter P Moore and Associates | 847,312 |
| 39 | TTG | 732,500 |
| 40 | DeSimone Consulting Engineers | 691,425 |
| 41 | H.F. Lenz | 652,000 |
| 42 | Paulus, Sokolowski and Sartor | 650,000 |
| 43 | I. C. Thomasson Associates | 600,000 |
| 44 | Vanderweil Engineers | 576,000 |
| 45 | Stanley Consultants | 447,960 |
| 46 | Zak Companies | 422,811 |
| 47 | Glumac | 421,563 |
| 48 | Allen & Shariff | 400,000 |
| 49 | KCI Technologies | 400,000 |
| 50 | Spectrum Engineers | 345,820 |
| 51 | TLC Engineering for Architecture | 342,071 |
| 52 | G&W Engineering Corp. | 217,100 |
| 53 | Sparling | 204,890 |
| 54 | Total Building Commissioning | 125,702 |
| 55 | Apogee Consulting Group | 115,325 |
| 56 | Barge Waggoner Sumner & Cannon | 100,000 |
| 57 | Brinjac Engineering | 80,270 |
| 58 | GHT Limited | 75,000 |
Top Retail Construction Firms
| Rank | Company | 2013 Retail Revenue |
| 1 | PCL Construction | $517,371,436 |
| 2 | Whiting-Turner Contracting Co., The | 479,057,948 |
| 3 | Shawmut Design and Construction | 386,000,000 |
| 4 | EMJ Corp. | 317,000,000 |
| 5 | Turner Construction | 236,380,000 |
| 6 | Balfour Beatty US | 195,847,685 |
| 7 | Lend Lease | 150,997,000 |
| 8 | Yates Companies, The | 122,000,000 |
| 9 | Hawkins Construction | 98,500,000 |
| 10 | Gray Construction | 97,770,000 |
| 11 | O'Neil Industries/W.E. O'Neil | 93,703,312 |
| 12 | Beck Group, The | 81,576,752 |
| 13 | Power Construction | 78,000,000 |
| 14 | S. M. Wilson & Co. | 72,877,695 |
| 15 | E.W. Howell | 71,900,000 |
| 16 | Structure Tone | 71,080,000 |
| 17 | DPR Construction | 70,199,893 |
| 18 | Choate Construction | 68,627,625 |
| 19 | KBE Building Corp. | 68,022,822 |
| 20 | Ryan Companies US | 67,191,615 |
| 21 | Weitz Company, The | 64,819,854 |
| 22 | Pepper Construction | 62,870,000 |
| 23 | JE Dunn Construction | 62,738,348 |
| 24 | Graycor | 59,864,863 |
| 25 | Hoar Construction | 53,500,000 |
| 26 | Hill & Wilkinson | 51,935,000 |
| 27 | McCarthy Holdings | 50,650,000 |
| 28 | Management Resource Systems | 45,255,861 |
| 29 | Leopardo Companies | 39,729,783 |
| 30 | Weis Builders | 37,993,000 |
| 31 | URS Corp. | 36,003,188 |
| 32 | Layton Construction | 35,900,000 |
| 33 | Clark Group | 35,131,316 |
| 34 | Brasfield & Gorrie | 33,249,173 |
| 35 | EBCO General Contractor | 33,134,000 |
| 36 | JLL | 30,323,117 |
| 37 | Paric Corp. | 25,000,000 |
| 38 | Skanska USA | 24,038,261 |
| 39 | C.W. Driver | 23,670,000 |
| 40 | James G. Davis Construction | 22,850,344 |
| 41 | Walbridge | 22,200,000 |
| 42 | Hill International | 21,000,000 |
| 43 | Tutor Perini Corp. | 20,562,786 |
| 44 | Bomel Construction | 19,179,585 |
| 45 | Kraus-Anderson Construction | 19,000,000 |
| 46 | Clune Construction | 17,825,626 |
| 47 | Austin Commercial | 17,584,385 |
| 48 | CORE Construction Group | 17,295,729 |
| 49 | Parsons Brinckerhoff | 16,431,889 |
| 50 | Hoffman Construction | 14,000,000 |
| 51 | LeChase Construction Services | 13,120,000 |
| 52 | Gilbane | 12,521,010 |
| 53 | IMC Construction | 12,332,000 |
| 54 | Kitchell Corp. | 11,602,544 |
| 55 | Suffolk Construction | 10,523,993 |
| 56 | McShane Companies, The | 6,599,886 |
| 57 | Manhattan Construction | 6,170,000 |
| 58 | Bernards | 4,700,000 |
| 59 | Adolfson & Peterson Construction | 3,534,704 |
| 60 | Robins & Morton | 3,351,771 |
| 61 | Batson-Cook | 2,741,450 |
| 62 | Stalco Construction | 2,310,600 |
| 63 | Bette Companies, The | 1,548,000 |
| 64 | Walsh Group, The | 1,485,547 |
| 65 | W. M. Jordan Company | 965,753 |
| 66 | Douglas Company, The | 772,135 |
| 67 | Allen & Shariff | 400,000 |
| 68 | Alberici Constructors | 156,054 |
Read full 2014 Giants 300 Report
Related Stories

| Feb 26, 2014
Use this app to streamline safety inspections
Using the iAuditor app, one of our Skanska teams developed electronic reports that make safety inspections more efficient, and that make it easier to address any issues emerging from them.

| Feb 26, 2014
Startup PocketCake aims to bring virtual reality simulations to the AEC masses
Founded in 2012, the development firm offers custom virtual reality simulations for the price of a typical architectural illustration.

| Feb 26, 2014
Billie Jean King National Tennis Center serving up three-phase expansion
The project includes the construction of two new stadiums and a retractable roof over the existing Arthur Ashe Stadium.

| Feb 25, 2014
Are these really the 'world's most spectacular university buildings'? [slideshow]
Emporis lists its top 13 higher education buildings from around the world. Do you agree with the rankings?

| Feb 25, 2014
NYC's Hudson Spire would be nation's tallest tower if built
Design architect MJM + A has released an updated design scheme for the planned 1,800-foot-tall, superthin skyscraper.
| Feb 24, 2014
White Paper: Using social media to build your business
This white paper from Benjamin Moore provides practical guidance for building and sustaining an effective online presence, with the ultimate goal of helping your painting business become more successful.
| Feb 24, 2014
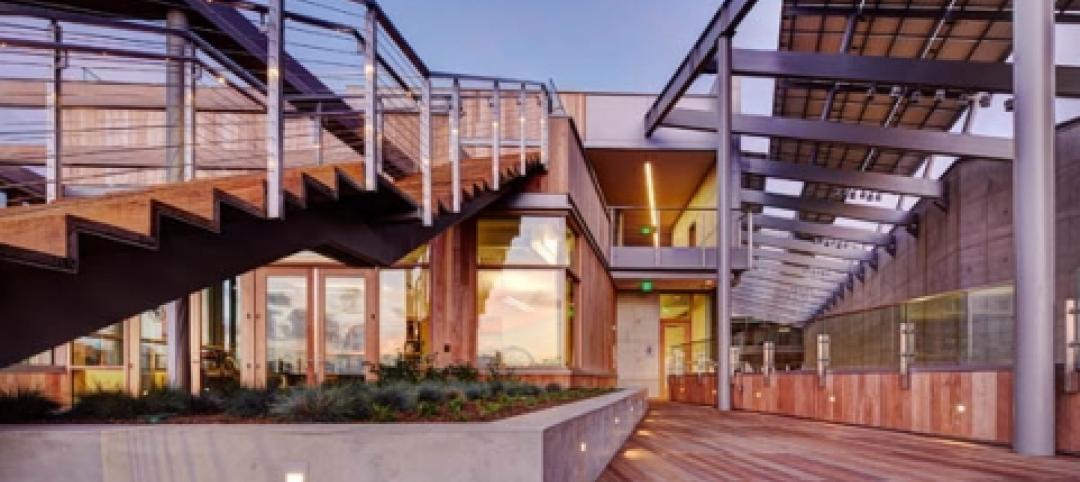
First look: UC San Diego opens net-zero biological research lab
The facility is intended to be "the most sustainable laboratory in the world," and incorporates natural ventilation, passive cooling, high-efficiency plumbing, and sustainably harvested wood.
| Feb 24, 2014
White Paper: The science of color and light
This white paper from Benjamin Moore provides an overview of the properties of color and light, along with practical guidance on how the relationship between the two affects design choices.

| Feb 21, 2014
Naturally ventilated hospital planned in Singapore
The Ng Teng Fong General Hospital will take advantage of the region's prevailing breezes to cool the spaces.

| Feb 21, 2014
Calatrava ordered to pay millions for 'shortcomings in his work' on conference center project
Famed architect Santiago Calatrava must pay 2.9 million euros due to faulty design work on the Palacio de Congresos project in Oviedo, Spain.


