In 2009, we met with Senior Facility Managers of four U.S. national laboratories to discuss a major limitation in the way they summarized their capital needs. As with most large organizations, they expressed capital needs in terms of deferred maintenance projects—things that needed to be fixed as determined by condition assessment (inspection or prescribed schedule). To put these needs in perspective, they computed a facility condition index (FCI), which is the ratio of deferred maintenance (D.M) costs to the replacement value of a building or portfolio.
Several years later, following the acquisition of Whitestone Research by CBRE Inc., it quickly became clear that major healthcare organizations around the world oftentimes employ a similar FCI based approach to their capital planning and prioritization decisions.
FACILITY CONDITION INDEX BREAKDOWN
According to a well-known scale developed initially for educational facilities in 1991, a facility is considered in poor condition if its FCI exceeds 90%. The shortcomings of the FCI approach are well-known, as results are not easily compared with alternative condition assessment approaches, and it does not contemplate methodologies for determining replacement values. These choices can become highly political for an organization that uses, as many do, the FCI as a key policy metric.
The basic concern of the laboratory facility managers was that the FCI did not represent the true condition of the facility in terms of safety, security, mission relevance, and other criteria that actually guide their decisions. FCI is also not a forecast or leading indicator that demonstrates consequences of alternative actions. These concerns led to a series of small projects that would eventually define a new approach to summarizing facility condition and prioritizing capital expenditures.
The new method, Risk Scanning, meets three requirements identified in our original meeting. The process must not rely on expensive inspections, must incorporate multiple (customizable) criteria, and the outcomes must be expressed as a simple monetary value.
This approach has universal applicability for laboratories and for large, corporate occupiers. In addition, we have found this approach to be particularly relevant for healthcare organizations today, given the extraordinary economic and regulatory pressures that have become a reality for the industry.
RISK SCANNING
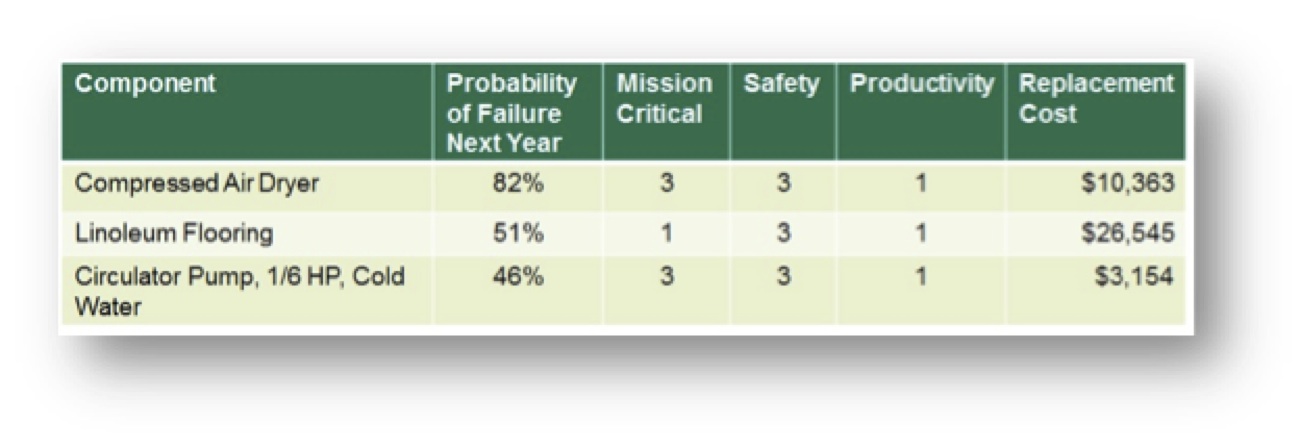
Risk Scanning assumes that buildings or other assets can be reduced to an inventory of components (roof, HVAC equipment, plumbing fixtures, etc.). Each component has a “survivor” curve that relates its age to the likelihood of its failure in the future, little different than an actuarial calculation for an insurance policy. And each component, should it fail, could have consequences for the building operation. Below, Figure 1 illustrates how this data could be used as a simple sort by probability of failure, consequence of failure, or replacement cost.
A more useful view of this data combines knowledge of the probability of failure and the potential consequences as the Risk Facility Managers implicitly consider when scheduling repairs. For example, a new light bulb in a closet would be low risk (low likelihood of failure, low impact on safety, security, mission, etc.), while a roof or electrical panel, far beyond their expected service life would be a high risk. Individual component risk ratings can be aggregated into risk maps by building, consequence type, or aggregated at the portfolio level.
Another example is a risk scan of a data center built in 1980, as shown in Figure 2. Risk is summarized by three consequences or threats of failure – mission, productivity and safety. The “Loss Intensity” is the measure (low, medium, high) of the impact of failure. Each cell in the tables is the sum of the replacement value of each component. For instance, in the first table there are high risk (red) components with replacement values totaling $374,210.
Figure 2: Dashboard showing risk by consequence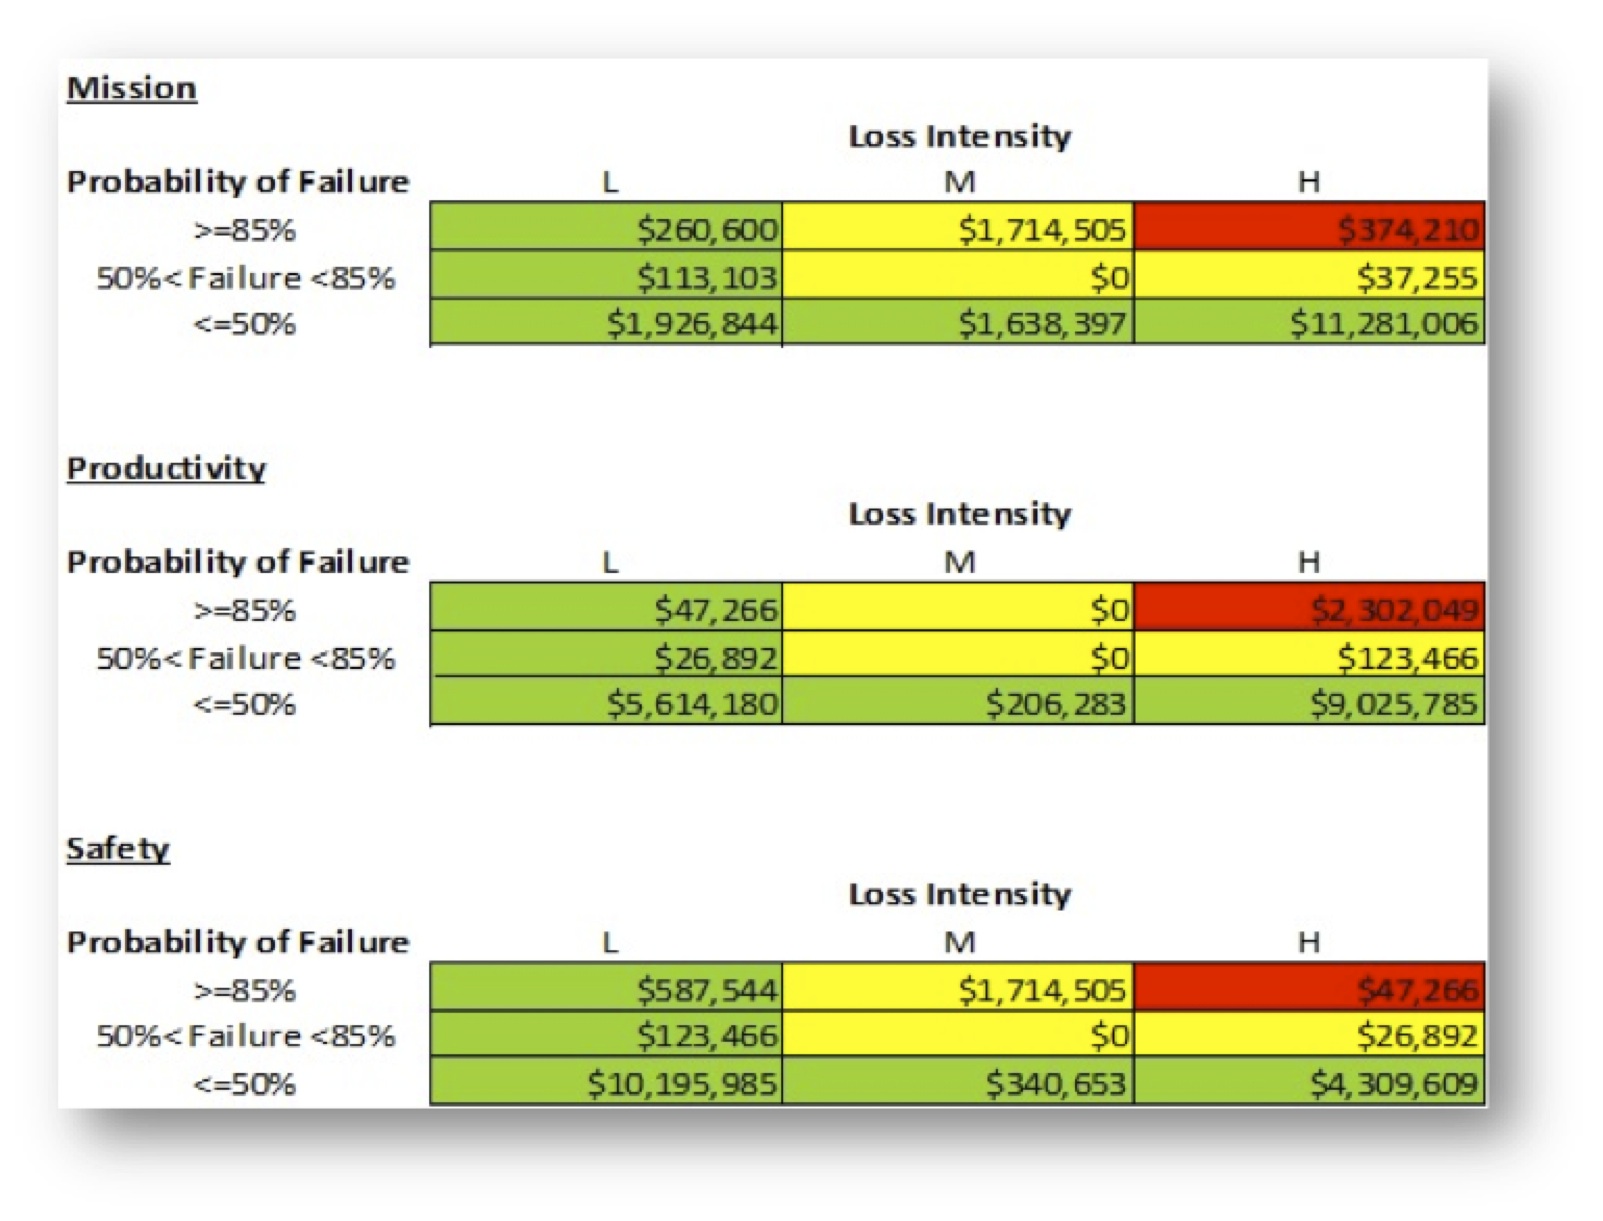
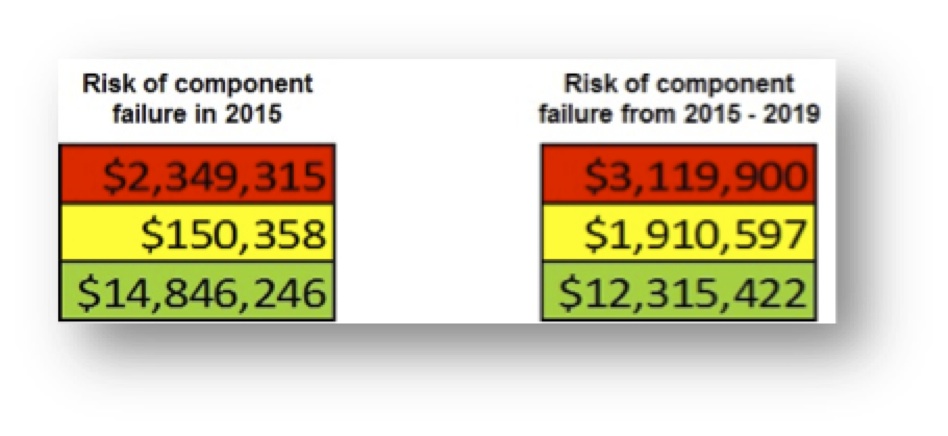
One way to represent overall risk is to sum across the individual tables in Figure 2, by risk category (red = high, yellow = moderate, green = low) to produce a single risk column, as shown in Figure 3. This shows that the costs to replace components rated high risk in 2015 for any reason (mission, productivity, or safety) were $2,349,315. Note that some components are high risk for multiple reasons.
The calculation of the column can be modified for different purposes. The ratings from the dashboard could be weighted to reflect management priorities. The likelihood of failure, and consequent migration of risk ratings, could be estimated for a range of years, as shown for the period 2015-2019.
COMPARING THE FCI WITH RISK SCANNING
The data center example provides a useful comparison of the output from a simple condition assessment with the additional data provided by Risk Scanning.
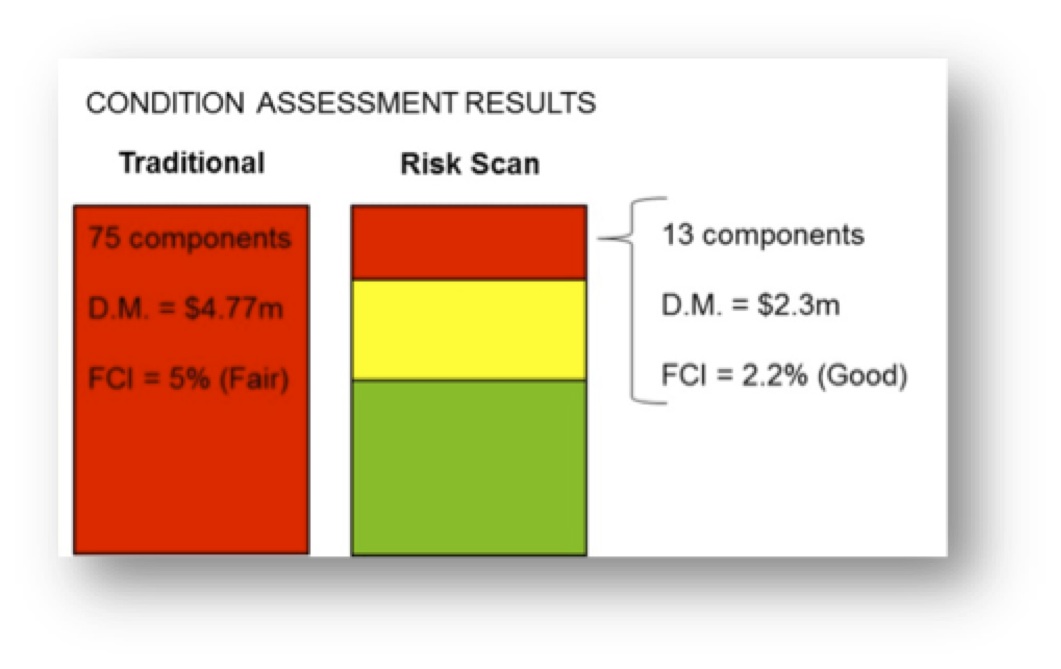
A conventional facility condition assessment using a life cycle cost model indicated that 75 components had exceeded their service life. The costs of replacing these would be $4,771,159. Considering this amount to be deferred maintenance (D.M.), the FCI would be 5% (given $100 million replacement value). This would be summarized as a building in “fair” condition.
A Risk Scan of the component inventory indicates that 13 components are at high risk, and the costs of replacing these would be $2,349,315. This is less than half the costs of replacements by a simple service life-assessment. An FCI based on high risk components would be 2.2%, indicating a building in “good” condition.
In this case, with the additional information provided by Risk Scanning, the facility would be considered in better condition than with the simple condition assessment. Moreover, the risk scan would provide a rating for all components—including those not yet considered as deferred maintenance—as a basis for anticipating future needs and prioritization.
CONCLUSION
The Risk Scanning approach uses well-known risk analytics applied to pre-existing facility data to provide a richer view of facility condition more consistent with actual management decision making. In practice, limited funding is directed to those repairs and replacements that address corporate priorities, such as safety, security, and mission achievement. For healthcare systems, this approach can provide critical insight for decision-making about capital deployment where actionable criteria are not established or where data is limited.
About the Authors
Peter Lufkin is Senior Managing Director and Luca Romani is Senior Analyst with CBRE Whitestone.
Related Stories
Architects | May 2, 2024
Emerging considerations in inclusive design
Design elements that consider a diverse population of users make lives better. When it comes to wayfinding, some factors will remain consistent—including accessibility and legibility.
K-12 Schools | Apr 30, 2024
Fully electric Oregon elementary school aims for resilience with microgrid design
The River Grove Elementary School in Oregon was designed for net-zero carbon and resiliency to seismic events, storms, and wildfire. The roughly 82,000-sf school in a Portland suburb will feature a microgrid—a small-scale power grid that operates independently from the area’s electric grid.
AEC Tech | Apr 30, 2024
Lack of organizational readiness is biggest hurdle to artificial intelligence adoption
Managers of companies in the industrial sector, including construction, have bought the hype of artificial intelligence (AI) as a transformative technology, but their organizations are not ready to realize its promise, according to research from IFS, a global cloud enterprise software company. An IFS survey of 1,700 senior decision-makers found that 84% of executives anticipate massive organizational benefits from AI.
Codes and Standards | Apr 30, 2024
Updated document details methods of testing fenestration for exterior walls
The Fenestration and Glazing Industry Alliance (FGIA) updated a document serving a recommended practice for determining test methodology for laboratory and field testing of exterior wall systems. The document pertains to products covered by an AAMA standard such as curtain walls, storefronts, window walls, and sloped glazing. AAMA 501-24, Methods of Test for Exterior Walls was last updated in 2015.
MFPRO+ News | Apr 29, 2024
World’s largest 3D printer could create entire neighborhoods
The University of Maine recently unveiled the world’s largest 3D printer said to be able to create entire neighborhoods. The machine is four times larger than a preceding model that was first tested in 2019. The older model was used to create a 600 sf single-family home made of recyclable wood fiber and bio-resin materials.
K-12 Schools | Apr 29, 2024
Tomorrow's classrooms: Designing schools for the digital age
In a world where technology’s rapid pace has reshaped how we live, work, and communicate, it should be no surprise that it’s also changing the PreK-12 education landscape.
Adaptive Reuse | Apr 29, 2024
6 characteristics of a successful adaptive reuse conversion
In the continuous battle against housing shortages and the surplus of vacant buildings, developers are turning their attention to the viability of adaptive reuse for their properties.
AEC Innovators | Apr 26, 2024
National Institute of Building Sciences announces Building Innovation 2024 schedule
The National Institute of Building Sciences is hosting its annual Building Innovation conference, May 22-24 at the Capital Hilton in Washington, D.C. BI2024 brings together everyone who impacts the built environment: government agencies, contractors, the private sector, architects, scientists, and more.
Mass Timber | Apr 25, 2024
Bjarke Ingels Group designs a mass timber cube structure for the University of Kansas
Bjarke Ingels Group (BIG) and executive architect BNIM have unveiled their design for a new mass timber cube structure called the Makers’ KUbe for the University of Kansas School of Architecture & Design. A six-story, 50,000-sf building for learning and collaboration, the light-filled KUbe will house studio and teaching space, 3D-printing and robotic labs, and a ground-level cafe, all organized around a central core.
Sports and Recreational Facilities | Apr 25, 2024
How pools can positively affect communities
Clark Nexsen senior architects Jennifer Heintz and Dorothea Schulz discuss how pools can create jobs, break down barriers, and create opportunities within communities.


