| Rank | Company | 2013 Healthcare Revenue |
| 1 | HDR | 191,150,000 |
| 2 | Stantec | 126,523,841 |
| 3 | HKS | 113,904,765 |
| 4 | CannonDesign | 108,000,000 |
| 5 | Perkins+will | 96,663,046 |
| 6 | HOK | 92,185,580 |
| 7 | NBBJ | 85,544,000 |
| 8 | Perkins Eastman | 69,750,000 |
| 9 | Hammel, Green and Abrahamson | 66,036,440 |
| 10 | SmithGroupJJR | 58,159,528 |
| 11 | RTKL Associates | 53,752,000 |
| 12 | Heery International | 42,516,564 |
| 13 | WHR Architects | 36,687,012 |
| 14 | Gresham, Smith and Partners | 36,627,000 |
| 15 | ZGF Architects | 36,269,781 |
| 16 | EwingCole | 29,360,000 |
| 17 | Leo A Daly | 28,569,588 |
| 18 | BSA LifeStructures | 26,974,792 |
| 19 | HMC Architects | 26,241,135 |
| 20 | FreemanWhite | 25,941,154 |
| 21 | Page | 25,000,000 |
| 22 | Skidmore, Owings & Merrill | 24,558,915 |
| 23 | Array Architects | 24,500,000 |
| 24 | Ballinger | 22,549,125 |
| 25 | Flad Architects | 22,000,000 |
| 26 | FKP Architects | 20,300,000 |
| 27 | CO Architects | 19,626,400 |
| 28 | Shepley Bulfinch | 16,286,000 |
| 29 | RBB Architects | 16,078,351 |
| 30 | Francis Cauffman | 14,782,519 |
| 31 | GBBN Architects | 14,600,000 |
| 32 | Hoefer Wysocki Architecture | 14,575,000 |
| 33 | Anderson Mikos Architects | 13,162,600 |
| 34 | Gensler | 12,160,524 |
| 35 | VOA Associates | 12,092,850 |
| 36 | Taylor Design | 11,900,000 |
| 37 | Ennead Architects | 11,126,793 |
| 38 | Ascension Group Architects | 10,200,000 |
| 39 | LBL Architects | 9,600,000 |
| 40 | Westlake Reed Leskosky | 9,361,000 |
| 41 | Harvard Jolly Architecture | 9,117,122 |
| 42 | TEG Architects | 8,735,194 |
| 43 | Harley Ellis Devereaux | 8,610,000 |
| 44 | H+L Architecture | 7,949,952 |
| 45 | Hord Coplan Macht | 7,185,711 |
| 46 | Sherlock, Smith & Adams | 6,830,000 |
| 47 | Eppstein Uhen Architects | 6,733,372 |
| 48 | CTA Architects Engineers | 5,899,027 |
| 49 | DesignGroup | 5,764,780 |
| 50 | Corgan | 5,489,064 |
| 51 | Moody Nolan | 5,419,622 |
| 52 | Davis Brody Bond | 5,249,703 |
| 53 | RS&H | 4,900,000 |
| 54 | Swanke Hayden Connell Architects | 4,500,000 |
| 55 | NORR | 4,230,087 |
| 56 | RSP Architects | 4,013,000 |
| 57 | Payette | 4,007,323 |
| 58 | EYP Architecture & Engineering | 4,000,000 |
| 59 | Little | 3,867,240 |
| 60 | DLR Group | 3,600,000 |
| 61 | Polytech Associates | 3,500,000 |
| 62 | NAC|Architecture | 3,350,380 |
| 63 | S/L/A/M Collaborative, The | 3,201,584 |
| 64 | LS3P | 3,157,653 |
| 65 | Clark Nexsen | 2,958,024 |
| 66 | Morris Architects | 2,500,000 |
| 67 | Cuningham Group Architecture | 2,382,021 |
| 68 | LawKingdon Architecture | 2,100,000 |
| 69 | FXFOWLE Architects | 1,970,000 |
| 70 | Goodwyn Mills & Cawood | 1,900,645 |
| 71 | Ware Malcomb | 1,838,500 |
| 72 | Baskervill | 1,835,599 |
| 73 | Kirksey | 1,685,145 |
| 74 | Albert Kahn Associates | 1,681,793 |
| 75 | Fentress Architects | 1,590,000 |
| 76 | Callison | 1,468,594 |
| 77 | Parkhill, Smith & Cooper | 1,318,000 |
| 78 | Vocon | 1,314,736 |
| 79 | PBK | 1,100,000 |
| 80 | LPA | 1,066,607 |
| 81 | Ratio Architects | 1,061,022 |
| 82 | Legat Architects | 960,000 |
| 83 | Epstein | 860,000 |
| 84 | Bergmann Associates | 800,540 |
| 85 | Becker Morgan Group | 746,064 |
| 86 | BLDD Architects | 730,000 |
| 87 | NTD Architecture | 720,000 |
| 88 | Rosser International | 702,307 |
| 89 | Rule Joy Trammell + Rubio | 625,000 |
| 90 | Environetics | 542,171 |
| 91 | Nadel | 500,000 |
| 92 | Inventure Design Group | 480,709 |
| 93 | Margulies Perruzzi Architects | 464,175 |
| 94 | Hoffmann Architects | 435,000 |
| 95 | PGAL | 365,500 |
| 96 | Emersion Design | 317,796 |
| 97 | Cooper Carry | 292,544 |
| 98 | LaBella Associates | 261,220 |
| 99 | Carrier Johnson + Culture | 244,037 |
| 100 | SEI Design Group | 236,000 |
| 101 | KZF Design | 210,477 |
| 102 | Poskanzer Skott | 200,000 |
| 103 | Symmes Maini & McKee Associates | 140,000 |
| 104 | Smallwood, Reynolds, Stewart, Stewart & Associates | 130,318 |
| 105 | Mithun | 116,000 |
| 106 | MBH Architects | 90,000 |
| 107 | Nelson | 75,745 |
| 108 | FitzGerald Associates Architects | 66,500 |
| 109 | OZ Architecture | 66,500 |
| 110 | ai Design Group | 64,620 |
| 111 | Integrus Architecture | 52,269 |
| 112 | CASCO Diversified Corp. | 50,000 |
| 113 | Commonwealth Architects | 41,673 |
| 114 | ATA Beilharz Architects | 33,225 |
| 115 | Wight & Company | 5,000 |
| 116 | Kohn Pedersen Fox Associates | 2,000 |
Read the Healthcare Giants article
Read BD+C's full 2014 Giants 300 Report
Related Stories
| Jan 19, 2011
Architecture Billings Index jumped more than 2 points in December
On the heels of its highest mark since 2007, the Architecture Billings Index jumped more than two points in December. The American Institute of Architects reported the December ABI score was 54.2, up from a reading of 52.0 the previous month.
| Jan 19, 2011
Large-Scale Concrete Reconstruction Solid Thinking
Driven by both current economic conditions and sustainable building trends, Building Teams are looking more and more to retrofits and reconstruction as the most viable alternative to new construction. In that context, large-scale concrete restoration projects are playing an important role within this growing specialty.
| Jan 10, 2011
Architect Jean Nouvel designs an island near Paris
Abandoned by carmaker Renault almost 20 years ago, Seguin Island in Boulogne-Billancourt, France, is being renewed by architect Jean Nouvel. Plans for the 300,000-square-meter project includes a mix of culture, commerce, urban parks, and gardens, which officials hope will attract both Parisians and tourists.
| Jan 10, 2011
Michael J. Alter, president of The Alter Group: ‘There’s a significant pent-up demand for projects’
Michael J. Alter, president of The Alter Group, a national corporate real estate development firm headquartered in Skokie, Ill., on the growth of urban centers, project financing, and what clients are saying about sustainability.
| Jan 7, 2011
BIM on Target
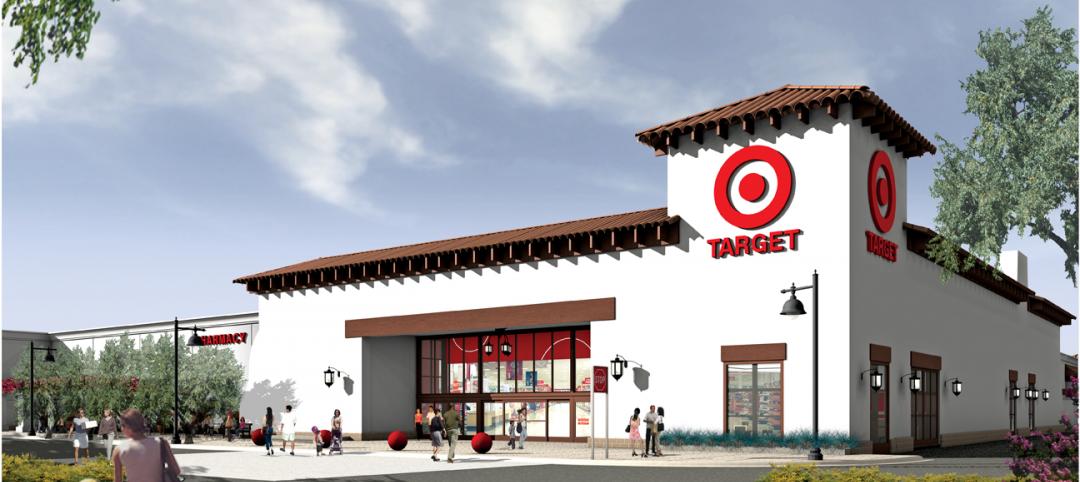
By using BIM for the design of its new San Clemente, Calif., store, big-box retailer Target has been able to model the entire structural steel package, including joists, in 3D, chopping the timeline for shop drawings from as much as 10 weeks down to an ‘unheard of’ three-and-a-half weeks.
| Jan 7, 2011
How Building Teams Choose Roofing Systems
A roofing survey emailed to a representative sample of BD+C’s subscriber list revealed such key findings as: Respondents named metal (56%) and EPDM (50%) as the roofing systems they (or their firms) employed most in projects. Also, new construction and retrofits were fairly evenly split among respondents’ roofing-related projects over the last couple of years.
| Jan 7, 2011
Total construction to rise 5.1% in 2011
Total U.S. construction spending will increase 5.1% in 2011. The gain from the end of 2010 to the end of 2011 will be 10%. The biggest annual gain in 2011 will be 10% for new residential construction, far above the 2-3% gains in all other construction sectors.
| Jan 7, 2011
Mixed-Use on Steroids
Mixed-use development has been one of the few bright spots in real estate in the last few years. Successful mixed-use projects are almost always located in dense urban or suburban areas, usually close to public transportation. It’s a sign of the times that the residential component tends to be rental rather than for-sale.


